Z E M C H 2 0 1 2 I n t e r n a t i o n a l C o n f e r e n c e
248
Methods
The indoor air-circulation and thermal problem are analysed through a mixed stabilized
finite element method (like Petrov-Galerkin) (Franca and Frey 1992)and the SUPG
(Streamline Up-wind Petrov-Galerkin) (Brooks and Hughes 1982), a stabilized finite
element method as in Drach (Drach 2010). The problem of air circulation and heat
transfer was modelled through mass, momentum and energy conservation equations,
assuming incompressibility. The program was developed in Fortran language and it was
based on the one DLearn by T.J.R. Hughes (in textbook: The Finite Element Method).
Simulations
A 2D computational approach was used in this work, but it can be broadened into a 3D-
by-layers scheme and also into a 3D full approximation, since the mathematical
formulation poses no restriction to any dimension (Drach 2010).
The model used deals with ventilation within openings and closed spaces, with possible
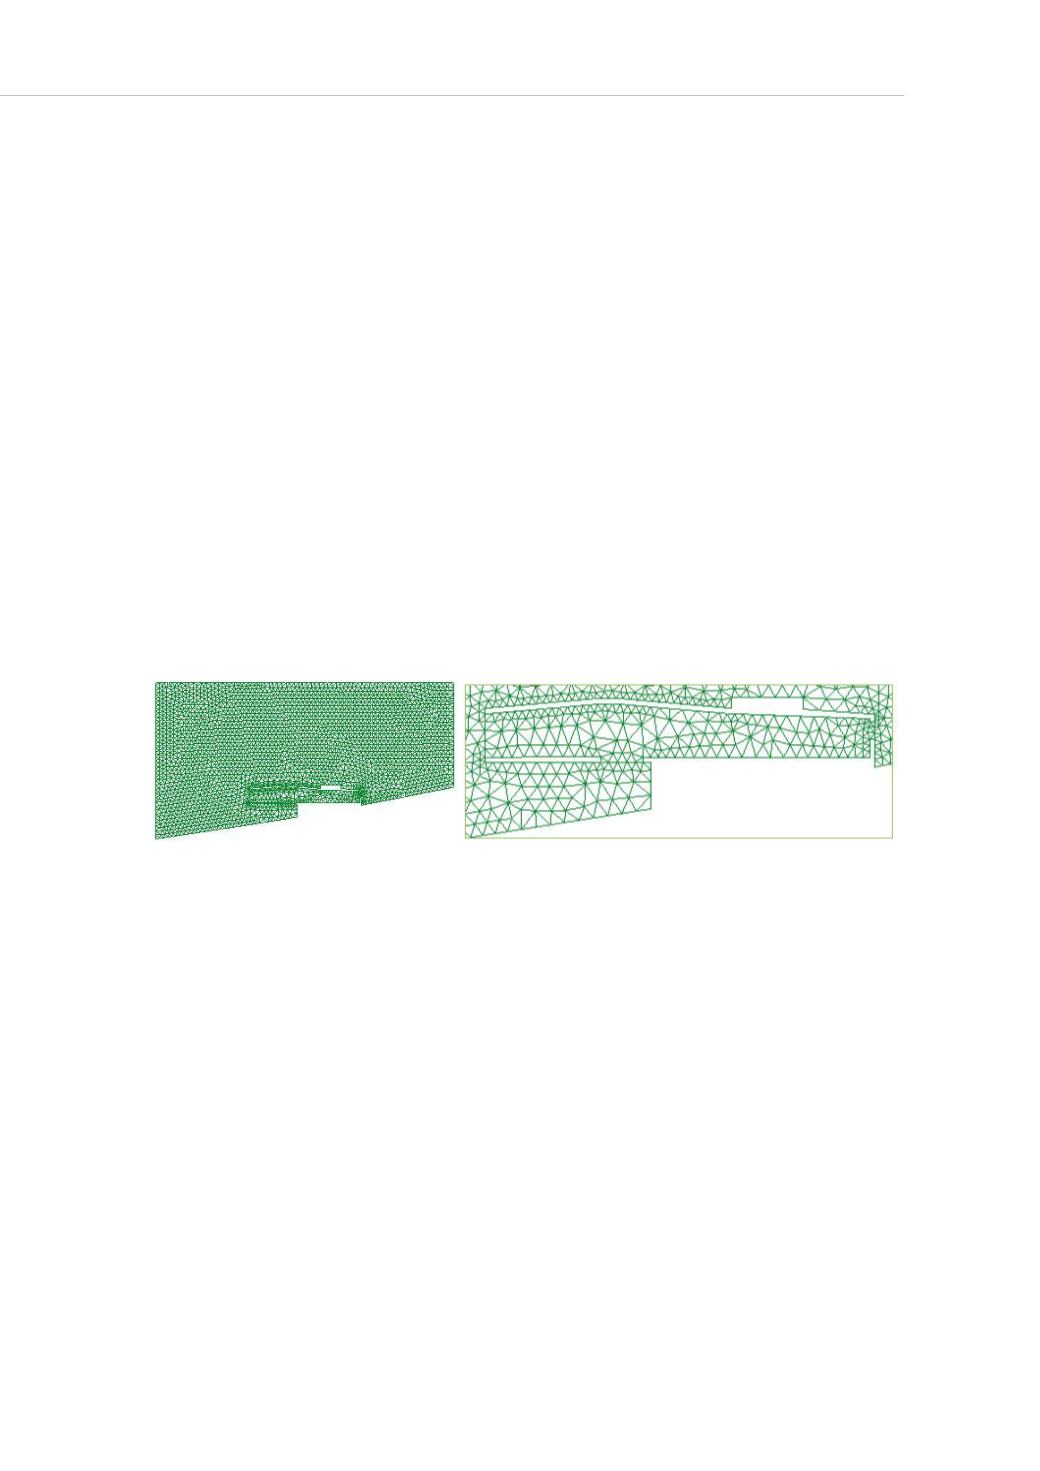
leakage not being considered. The meshes generated for the experiments were
composed by linear triangular elements which have collective dimensions that comprise
areas bigger than the ones in the plants. The boundary conditions are imposed on their
borders, so, the velocities and the temperatures at the entrances are considered to be
unknowns and could be determined by the solution of the problem. In Figure 4, mesh
and its detail can be observed.
a b
Figure 4: Global mesh (a) and its detail.
To test the situation for low winds, the boundary conditions adopted for outdoor wind
were 1 m/s. The criterion for choosing a low velocity of air, which corresponds to a
breeze, was that it reflects the worst condition for ventilation, for hot tropical climates. An
outdoor temperature of 29
o
C was selected, it corresponds approximately to the one of
the March average, which is amongst the highest temperature averages observed in São
Paulo city. This value was selected from data at the Instituto Nacional de Meteorologia –
INMET (Meteorology National Institute). For the indoor temperature, 31
o
C was taken as
a basis. The sketch in Figure 5 shows the boundary and initial conditions adopted and
the arrow on the top of the figure indicates outdoor wind direction and intensity. The
initial temperatures are indicated inside the squares. The same conditions were imposed
to all experiments to make it possible to compare them.


