C o m p u t a t i o n a l S i m u l a t i o n
249
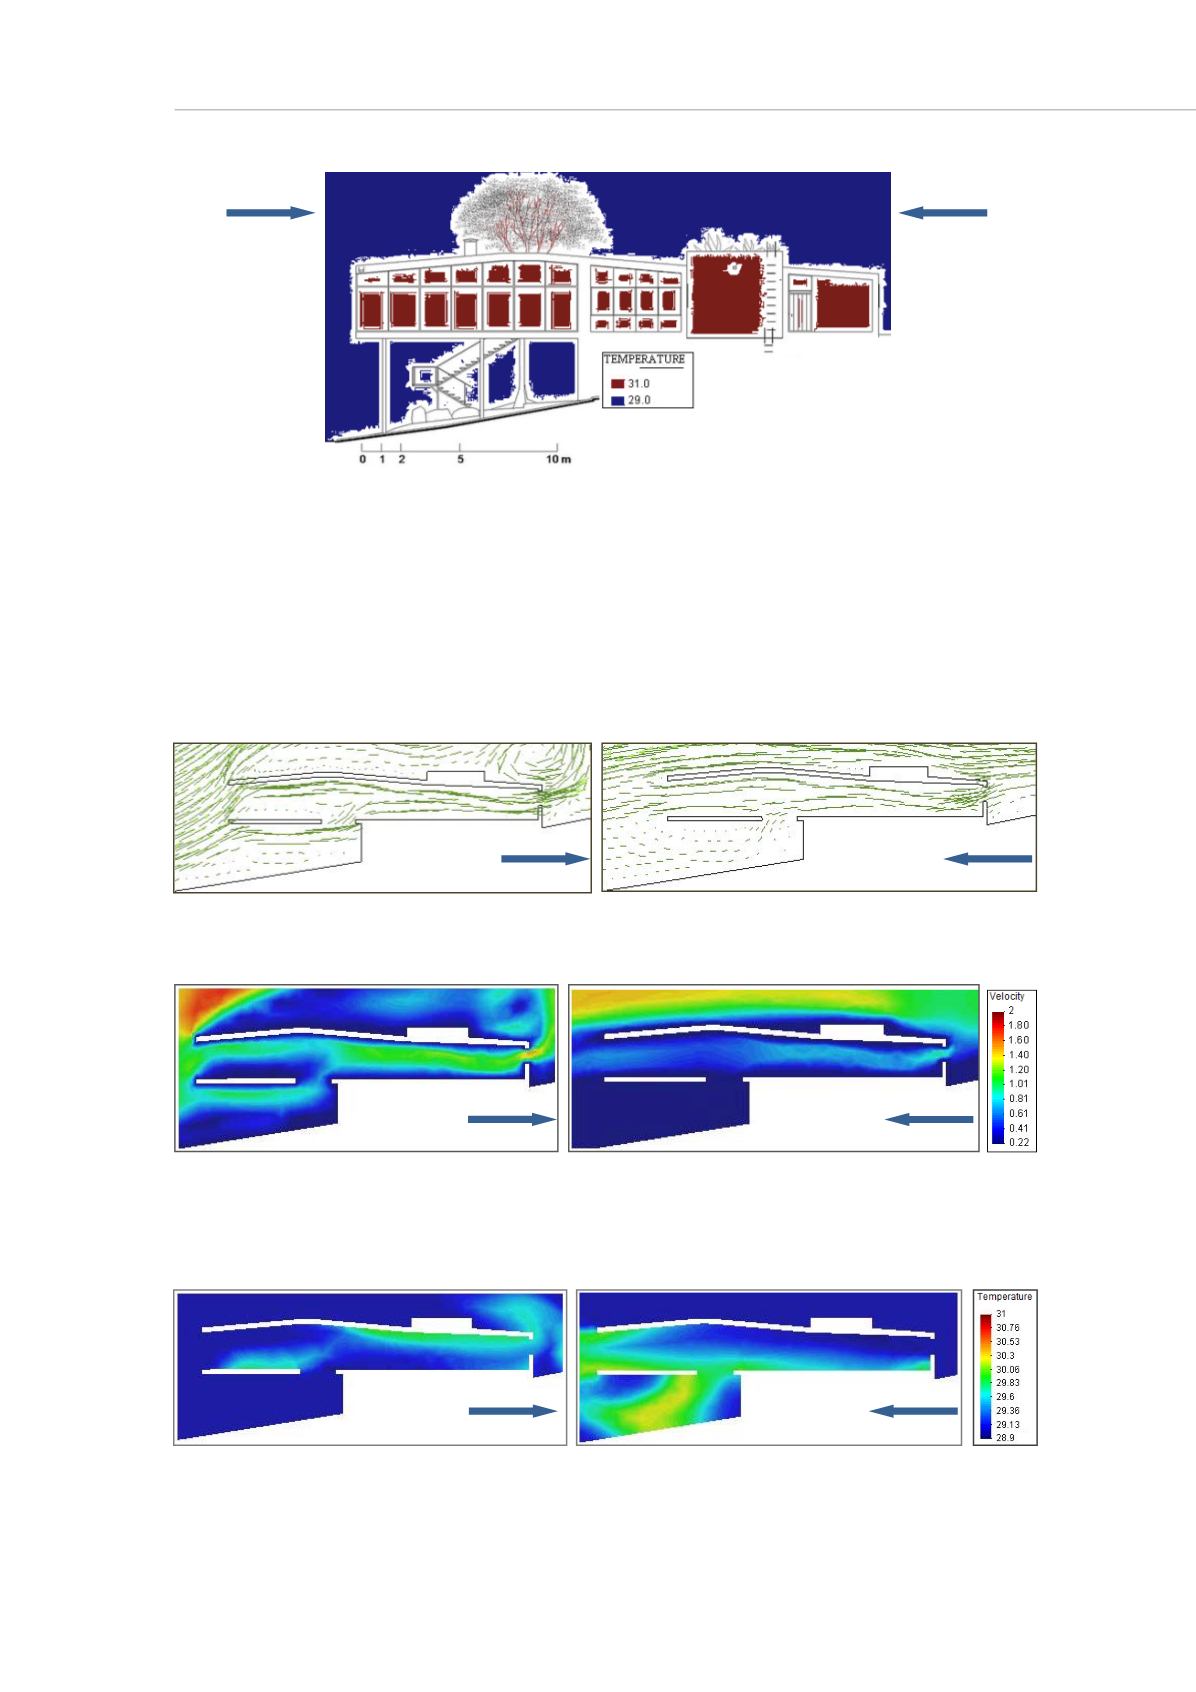
Figure 5: Boundary (wind direction: scenario 1 and scenario 2) and initial conditions.
Results and Discussion
The results for both cases, i.e., with the two wind directions presented in terms of
velocity wind field in Figure 6, and, in Figure 7, in terms of contour fill of |u| in a scale in
which the superior velocity in scale is 2 m/s. Through the temperature results presented
in Figure 8, we can notice that, regardless of the wind direction adopted, ventilation was
able to significantly reduce temperature.
a b
Figure 6: Velocity wind field: Scenario 1 (a) and Scenario 2 (b).
a b
c
Figure 7: Contour fill of |u|: Scenario 1 (a), Scenario 2 (b) and colour scale (c).
a b
c
Figure 8: Temperature results: Scenario 1 (a), Scenario 2 (b) and colour scale (c).
u
(1,0)
Scenario 1
u
(1,0)
Scenario 2
u
(1,0)
Scenario 1
u
(1,0)
Scenario 2
u
(1,0)
Scenario 1
u
(1,0)
Scenario 2
u
(1,0)
Scenario 1
u
(1,0)
Scenario 2


