B E N I M P A C T S u i t e
159
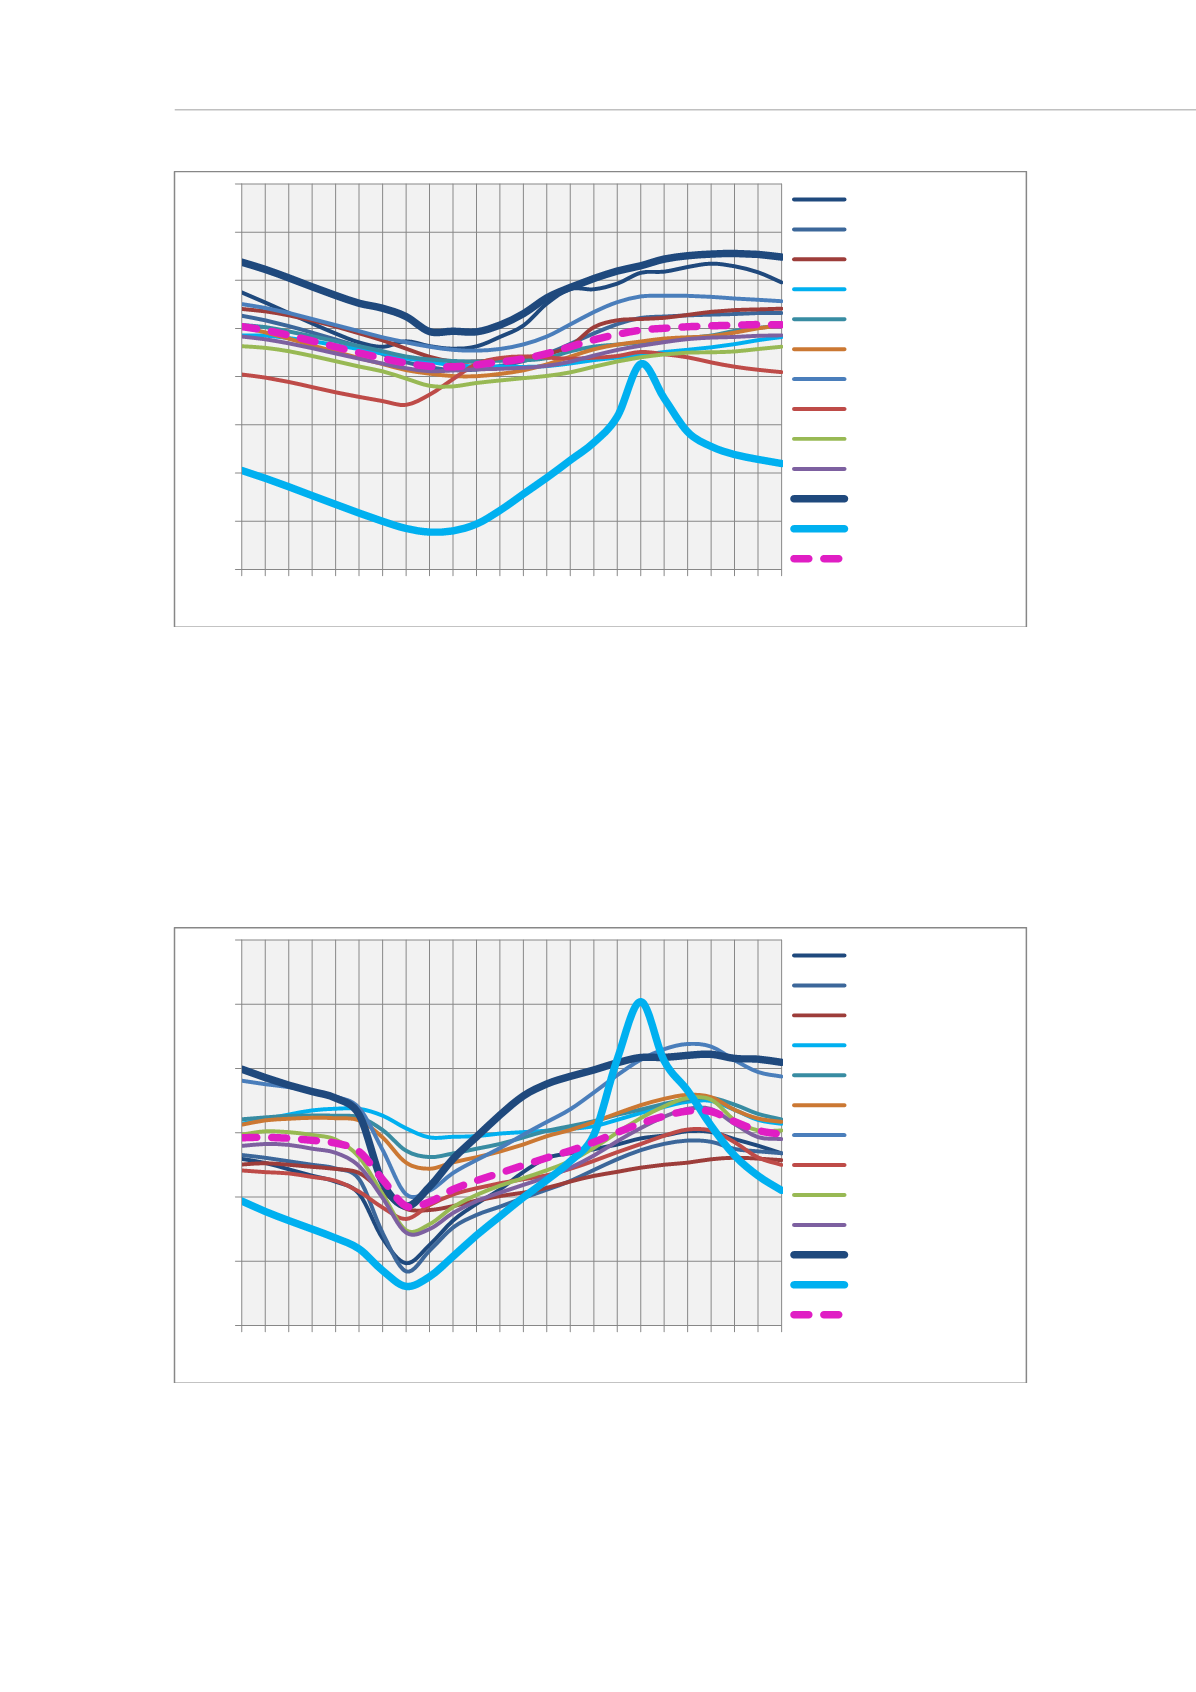
Graph 1: Monitored temperatures: typical winter day
Also in the
typical summer day
(Graph2) the same two rooms, the laundry and the office,
have an inhomogeneous behavior.
The laundry is still warmer due to its higher internal gains except in the morning, when
the windows are usually opened to allow the entire house to benefit of the passive
cooling down effect of fresh winds from North.
As in winter, the office curve presents an odd behavior, different from every other room.
This is due to the fact that this space is not conditioned. In particular it results
overheated during the afternoon because of its West window without sun protections.
Graph 2: Monitored temperatures: typical summer day
From the comparison of the two graphs (Graph1 and Graph2) it is possible to appreciate
that the summer and winter behavior of the office is really similar: the two curves have
an identical shape and they are just shifted along the temperature axis. This difference of
14
15
16
17
18
19
20
21
22
0 1 2 3 4 5 6 7 8 9 10 11 12 13 14 15 16 17 18 19 20 21 22 23
Temperature [°C]
Hour
Kitchen
Living room
House keeper App.
Room 1
Bathroom 1
Room 2
Corridor
Room 3
Bathroom 2
Wardrobe
Laundry
Office
Mean temperature
22
23
24
25
26
27
28
0 1 2 3 4 5 6 7 8 9 10 11 12 13 14 15 16 17 18 19 20 21 22 23
Temperature [°C]
Hour
Kitchen
Living room
House keeper App.
Room 1
Bathroom 1
Room 2
Corridor
Room 3
Bathroom 2
Wardrobe
Laundry
Office
Mean temperature


