B E N I M P A C T S u i t e
161
Small differences are due to the faster response of the model, which has less internal
mass, since most internal walls and the furniture are not simulated.
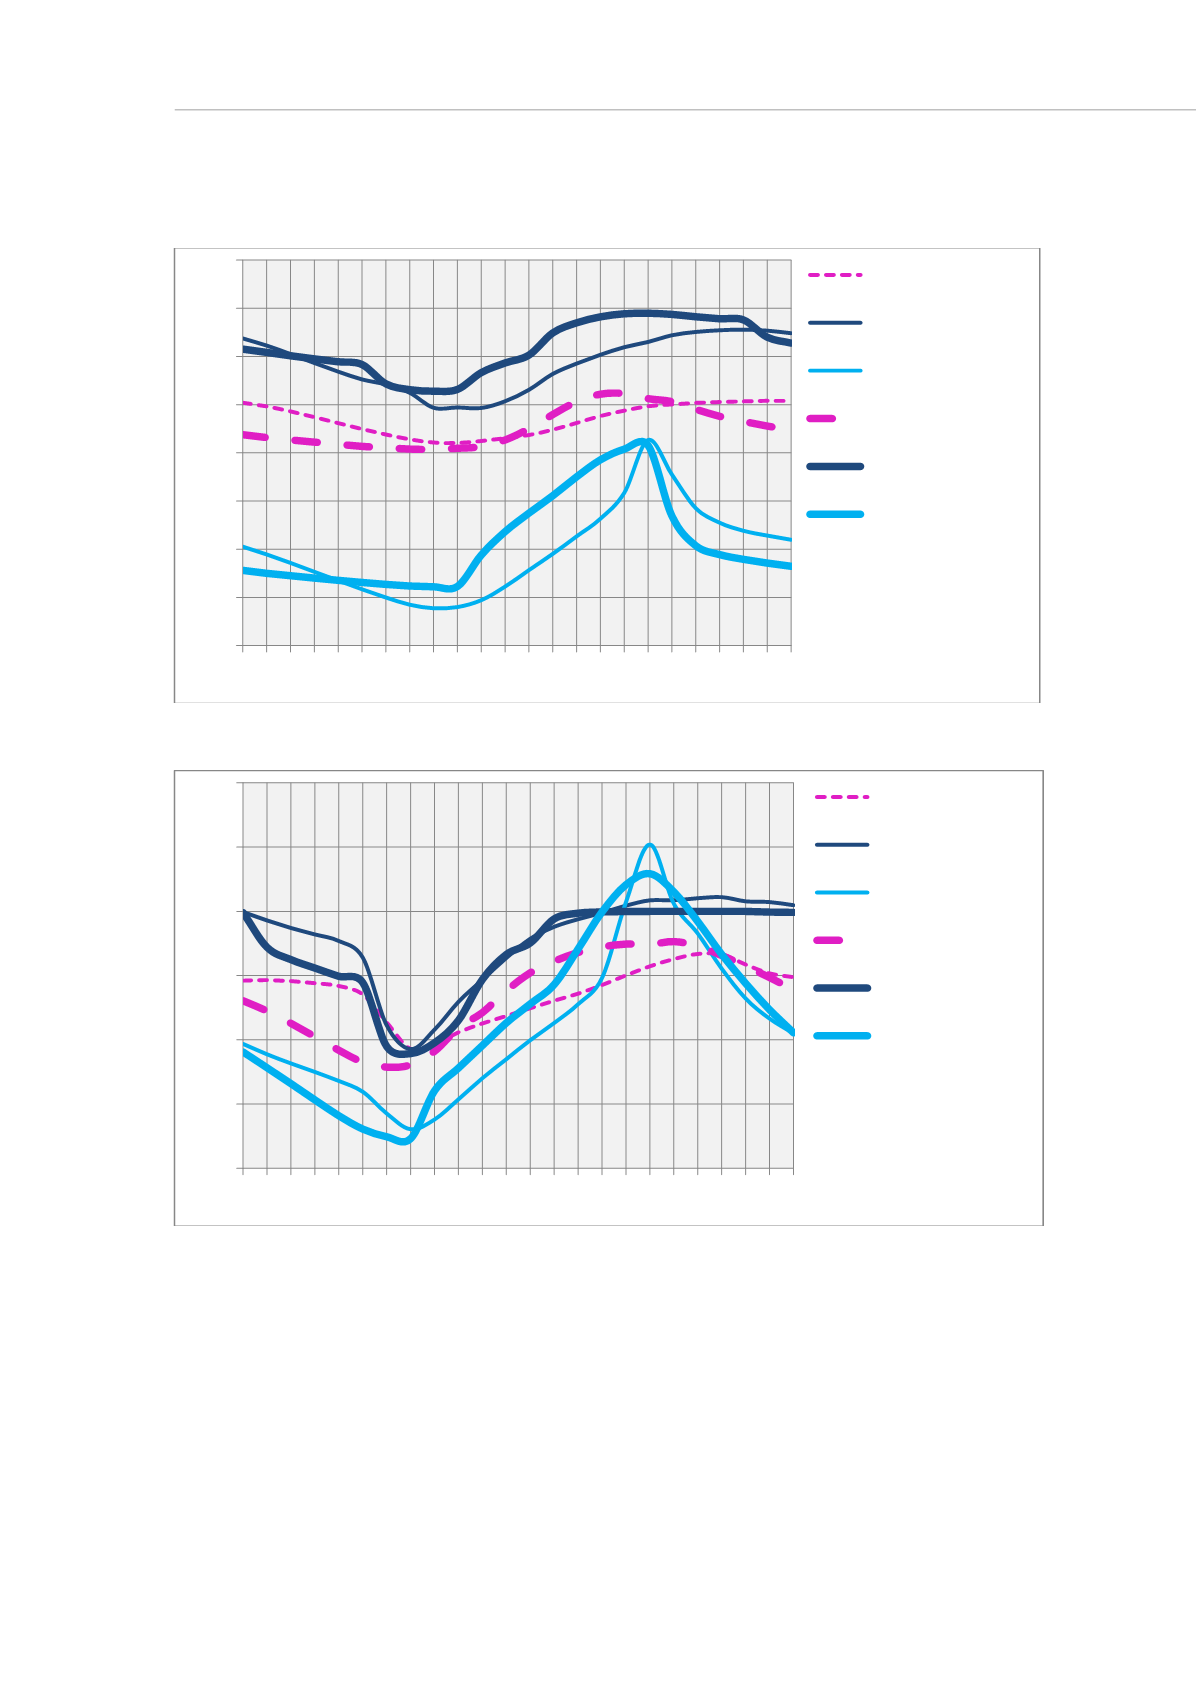
Graph 3: Monitored vs. simulated temperatures: typical winter day
Graph 4: Monitored vs. simulated temperatures: typical summer day
By means of the simulations not only energy consumption and temperatures were
verified, but also the
time constant
of the entire building, which depends on thermal
capacity and thermal transmittance of constructions.
It is interesting to see which is the real difference between the calculated time constant
for the real building and for the model.
For performing such kind of calculation for the building it was necessary to use
monitored data of a period in which the home was empty and every system inside not
used (end of November – beginning of December 2011).
The time constant
0
was calculated using the following formula:
14
15
16
17
18
19
20
21
22
0 1 2 3 4 5 6 7 8 9 10 11 12 13 14 15 16 17 18 19 20 21 22 23
Temperature [°C]
Hour
Mean temperature
Mon.
Laundry Mon.
Office Mon.
Living Space Sim.
Laundry Sim.
Office Sim.
22
23
24
25
26
27
28
0 1 2 3 4 5 6 7 8 9 10 11 12 13 14 15 16 17 18 19 20 21 22 23
Temperature [°C]
Hour
Mean temperature
Mon.
Laundry Mon.
Office Mon.
Living Space Sim.
Laundry Sim.
Office Sim.


