Z E M C H 2 0 1 2 I n t e r n a t i o n a l C o n f e r e n c e
692
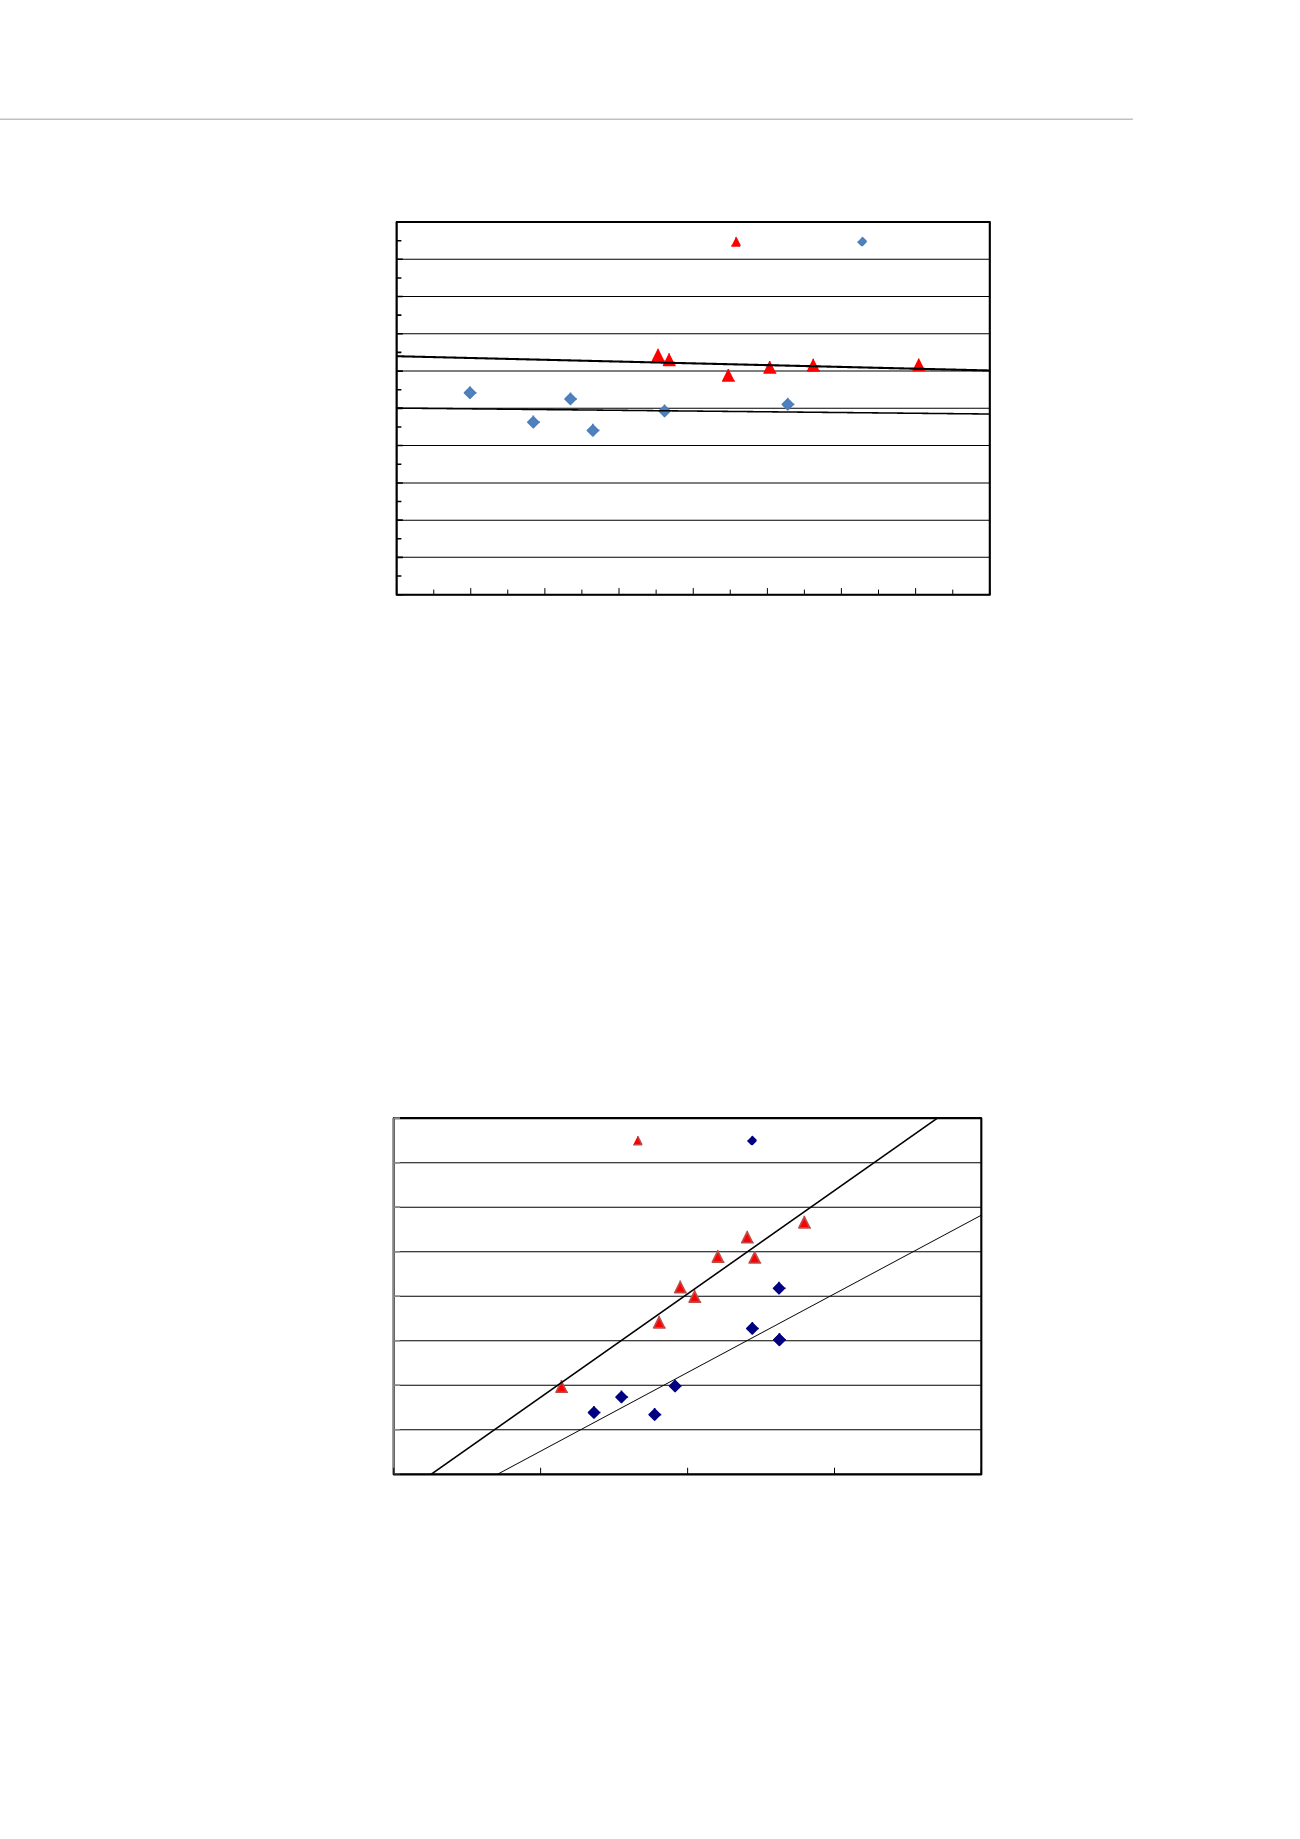
Figure 6: Electrical efficiency of the 12 tube PVT and 18 tube PVT
Performance comparison of the 18 tube PVT and PV module The electrical performance
of the PVT module can be represented as the electrical performance based on the
average fluid temperature and solar irradiation. The mean fluid temperature directly
affects the PV module’s temperature, and thus, influences electrical efficiency and
electrical power.
Fig. 7 shows the electrical power based on the solar irradiation at the mean fluid
temperatures of between 10
℃
and 21
℃
and between 22
℃
and 33
℃
. The fluid
temperatures of between 10
℃
and 21
℃
had higher electrical power than the between 22
℃
and 33
℃
. This is because the cooling effect of the PV module is greater at a lower fluid
temperature.
Figure 7: Electrical Power of the PVT module based on the solar irradiation at the mean fluid
temperatures of between 10
℃
and 21
℃
and between 22
℃
and 33
℃
(solar irradiation: 800-1000W/m
2
)
y = -0.0962x + 0.164
y = -0.0398x + 0.1501
0.10
0.11
0.12
0.13
0.14
0.15
0.16
0.17
0.18
0.19
0.20
0.000 0.005 0.010 0.015 0.020 0.025 0.030 0.035 0.040
Electrical efficiecy
(T
m
-T
a
)/G
18 tube PVT 12 tube PVT
y = 0.2321x + 1.6138
y = 0.1767x + 33.891
170
180
190
200
210
220
230
240
250
700
800
900
1000
1100
DC Power (W)
G (W/m
2
)
10-21 deg C 22-33 deg C


