F u t u r e E n e r g y D e m a n d i n U K H o u s i n g
333
central heating which is generally considered to be the most cost effective and relatively
efficient method of heating and 14.8% of those with gas or oil boilers had condensing
boilers.
All of these energy efficiency measures made the average heat loss of a dwelling
decreased from 376 W/°C in 1970 to 246.8 W/°C in 2006. The average SAP
rating in
1970 was about 18 and by 2006 this had increased to about 52 (see Figure 1b) (Utley
2008).
Typical Household Energy Consumption
Table 1 shows some of the typical existing dwellings’ performance. Most common house
type in the UK is a semi-detached house which is almost 30% of the existing housing
stock. The total CO
2
emissions for this type of house is 72 kg/m²/yr which equates to
about 6.5 tonnes of CO
2
per year; putting the house in band E. Since the dwelling is well
insulated, about 3.5 tonnes of the CO
2
emissions comes from energy used to the post
2002 mid-terraced home, which puts it in band C.
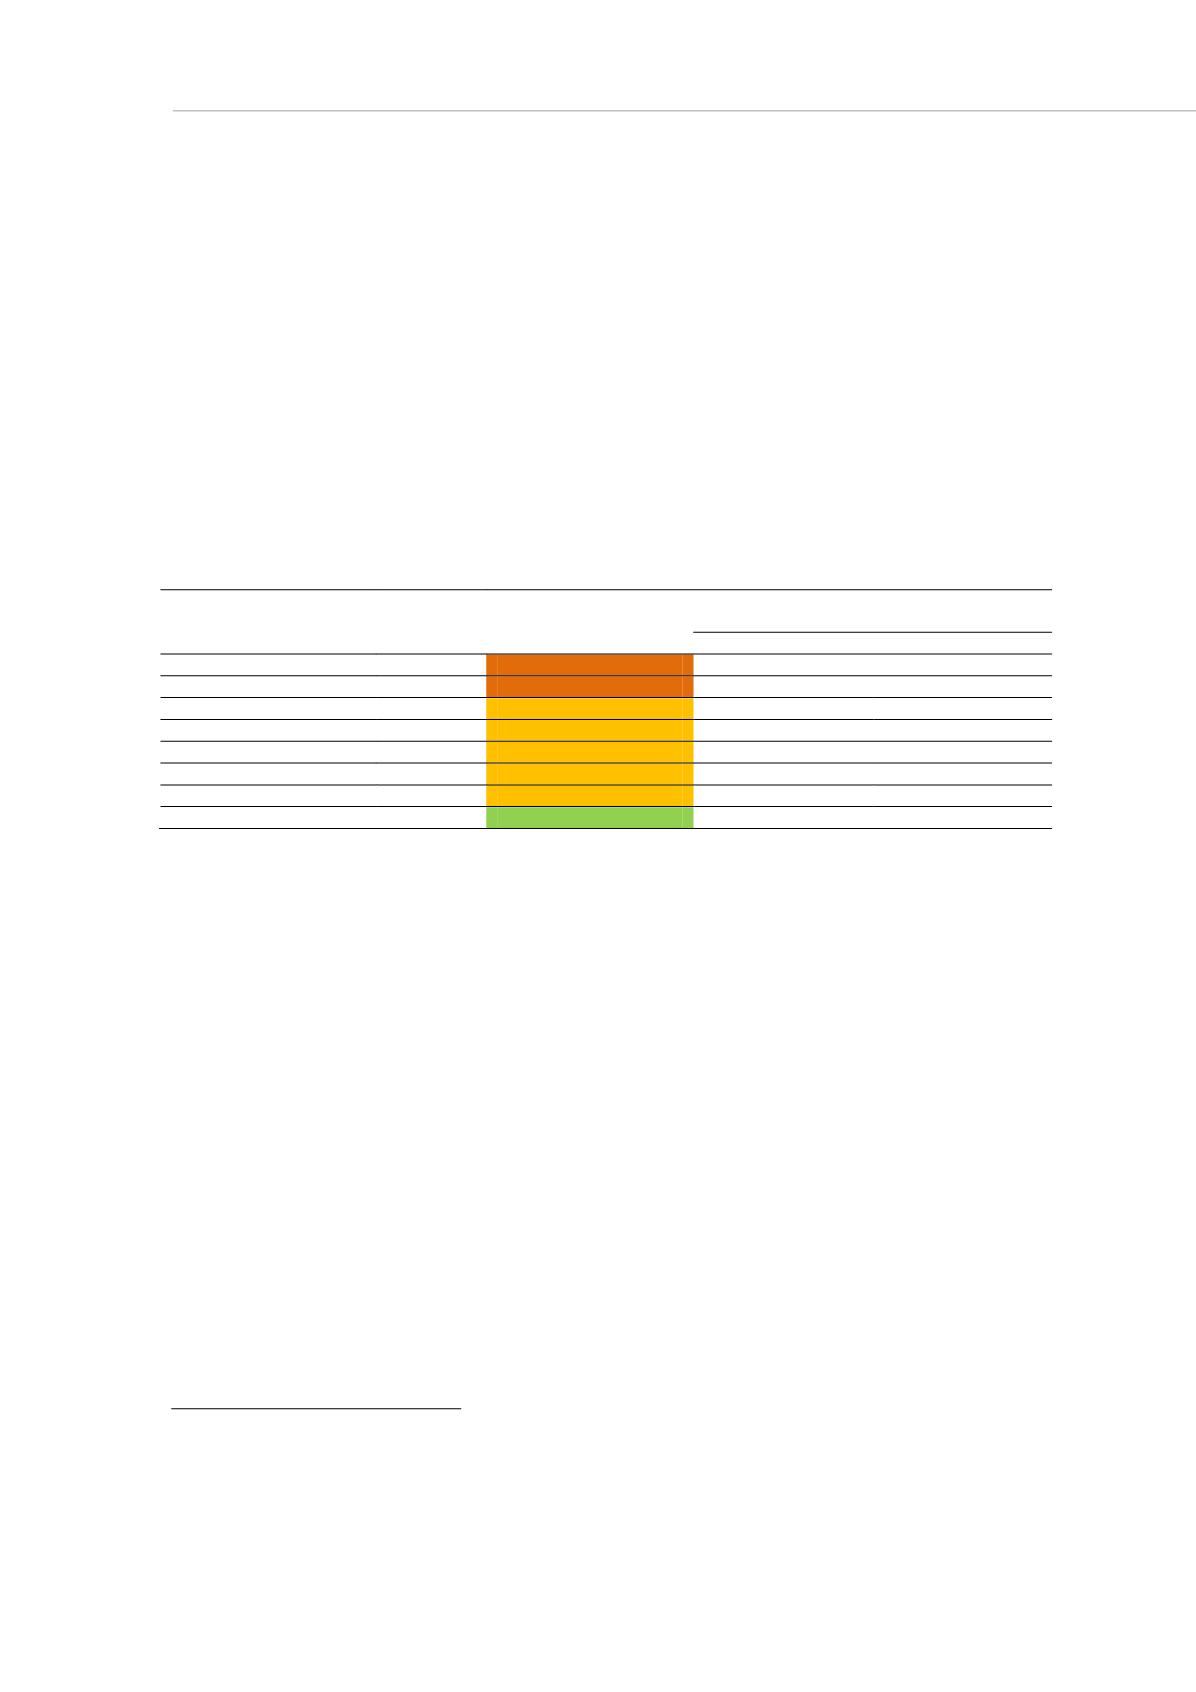
Table 1. Performance of UK typical existing dwellings (Energy Saving Trust 2010)
House type
Floor area
(m²)
Existing EPC Band
Existing total CO
₂
emissions
Tonnes/yr
Kg/m²/yr
Solid walled detached
104
F
13.7
132
Period end terrace
89
F
6.5
73
Period mid terrace
85
E
6.7
79
1950s semi-detached
90
E
6.5
72
1960s bungalow
64
E
6.2
98
1980s detached
111
E
7.7
69
1980s mid floor flat
61
E
4.2
68
Post 2002 mid terrace
79
C
3.4
43
The average household electricity consumption for lighting, appliances, cooking, heating
and cooling varies across the UK but this is average to around 4,700 kWh per annum.
For dwellings built to 2006 building regulations, overall energy consumption by end-use
was estimated as follows (see Figure 2). Moreover, Figure 2 and Table 1 show that with
an increased exposed wall area, the total energy consumption and CO
2
emissions are
increased.
Methodology
A thermal simulation programme have been used to theoretically test a four bedroom
terraced house under different climatic conditions from the IPCC TAR A2 scenarios. This
was completed to gain an understanding of energy consumption due to heating and
cooling demand. Many input parameters are involved in calculation of heating and
cooling loads. The effect of future climate on the relationship between these parameters
and the energy/carbon emission outcomes were also studied. The software is
DesignBuilder (version 2.2.5), which is an approved software by the UK Government and
was adopted to use the EnergyPlus calculation method for thermal analysis and energy
consumption in the case study home. From this, an advanced dynamic thermal
simulation using a finite element method and the calculation was driven by a weather
data which was provided by Meteonorm (version 6.1).
1
An alternative way of illustrating the overall effect of energy efficiency improvements is by considering the
energy rating of the average dwelling within the housing stock and for this purpose is the Government’s
Standard Assessment Procedure (SAP). This is a rating on a scale 1 to 100 where 1 indicates an extremely
energy inefficiency dwelling and 100 indicates an extremely energy efficient dwelling.


