I n d i v i d u a l H o u s e h o l d B e h a v i o u r M o d e l l i n g
537
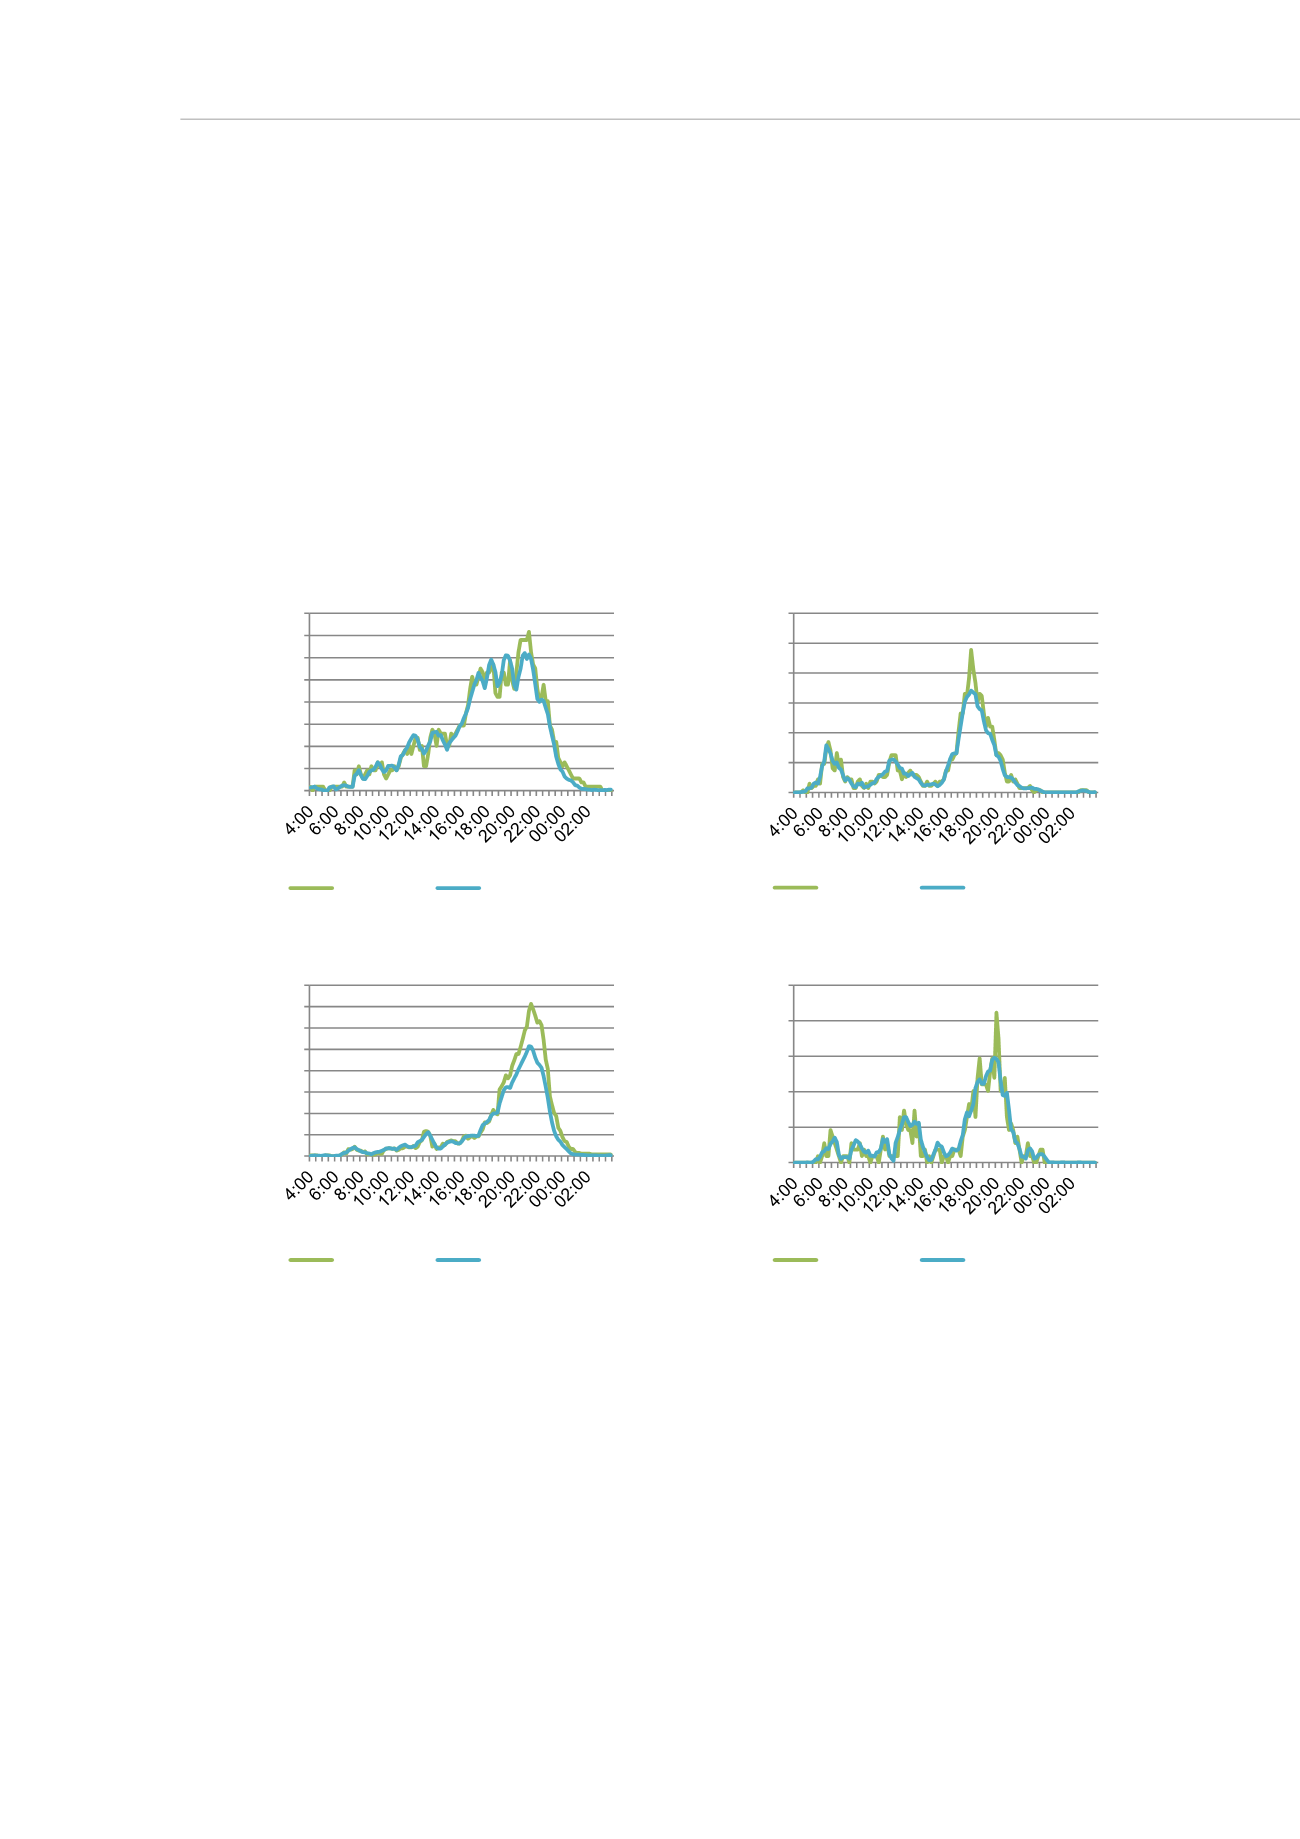
The average output from the activity model for a household with two adults (working full
time) with children for a weekday is presented in
The graphs show the fraction
of households where the activity occurs as a function of the time. For all of the presented
activities, a peak can be observed in the evening, indicating that the chance of an activity
occurring depends largely on the chance of people being at home and awake. The
modelled data deviates most from the measured data whenever peaks occur in the
latter. This is a result of the probability matrices, which are averaged over three time
steps. We can see that some activities are modelled more accurately than others, which
is confirmed by the R
2
values that are given. For the activity ‘watching TV’, there is
clearly an underestimation of the activity during the evening hours, whilst for ‘doing the
dishes’ the poor results are caused by the peak shaving effects, as mentioned before.
Further adjustments will be made in order to improve the accuracy of the model.
figure 10: Fraction of households where someone is (a) using a computer,
(b) preparing food, (c) watching TV or (d) doing the dishes (measured and
modelled)
Discussion and future work
Time-use data has proven to be highly interesting for behaviour- and energy demand
modelling because of the high time resolution in combination with the large amount of
activities registered. Furthermore, the method can easily be implemented in other
countries since many have their own time-use data available. However, some local
differences in the time-use registration methodology may involve important
consequences for behaviour modelling. In the first place, the choice between self-
described activities and pre-coded activities may influence the accuracy. In our case,
hardly any registrations were found for the activity ‘drying clothes’, presumably as a
0.00
0.02
0.04
0.06
0.08
0.10
0.12
0.14
0.16
Fraction of households where
activity occurs
Time (h)
(a) Using the computer
(R
2
= 0.96)
measured
modelled
0.00
0.05
0.10
0.15
0.20
0.25
0.30
Fraction of households where
activity occurs
Time (h)
(b) Preparing food
(R
2
= 0.96)
measured
modelled
0.00
0.10
0.20
0.30
0.40
0.50
0.60
0.70
0.80
Fraction of households where
activity occurs
Time (h)
(c) Watching TV
(R
2
= 0.91)
measured
modelled
0.00
0.02
0.04
0.06
0.08
0.10
Fraction of households where
activity occurs
Time (h)
(d) Doing the dishes
(R
2
= 0.91)
measured
modelled


