Z E M C H 2 0 1 2 I n t e r n a t i o n a l C o n f e r e n c e
530
employment type. A distinction is made between five respondent types: (1) adults
working full time, (2) adults working part time, (3) unemployed adults, (4) elderly and (5)
children over twelve years old. Subsequently, the combination of respondent types leads
to the definition of household types. Although there are no time-use patterns available for
children younger than twelve, their presence in the household is included as it is
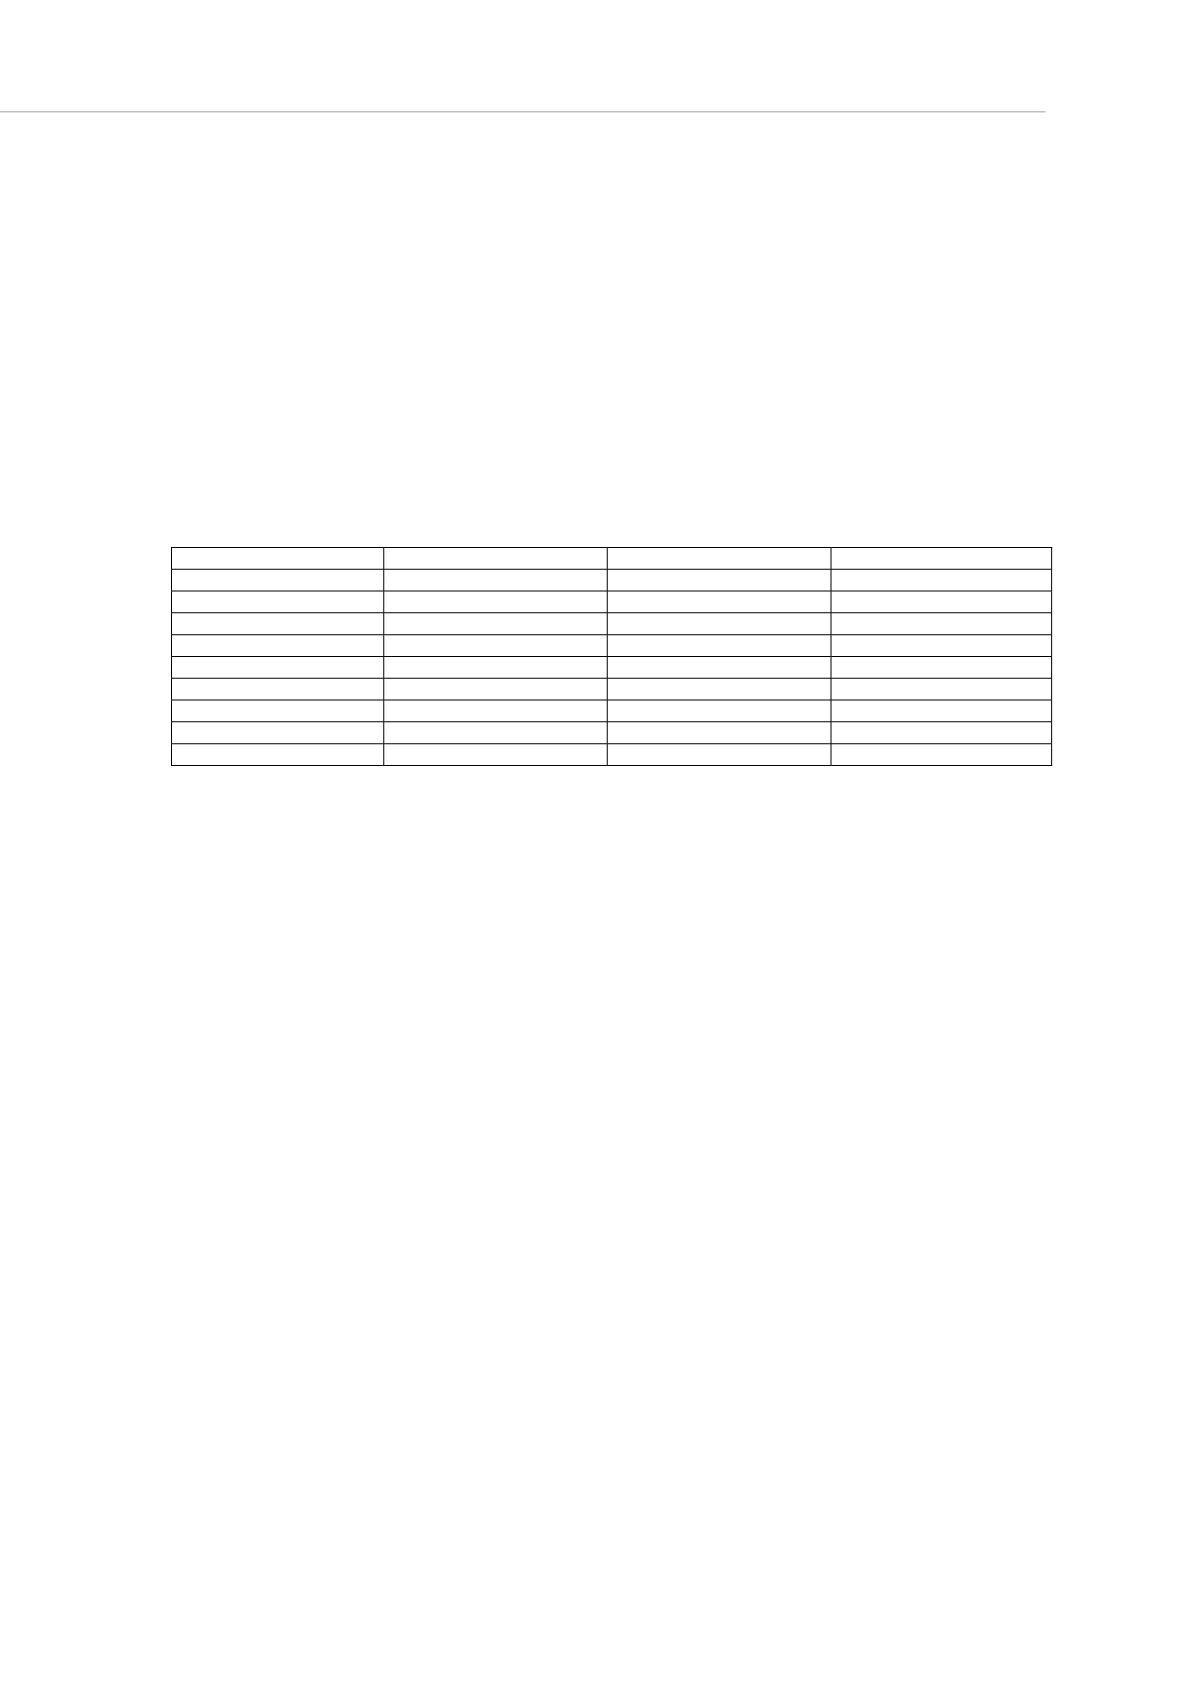
expected to influence the behaviour patterns of the parents. The household types that
are most frequently observed in the TUS database are shown in
In total, 2541 of
3360 households are covered by these nine household types. We deliberately do not
take any building characteristics into account since this should be handled with by a
building simulation model in which the behaviour patterns are to be implemented.
Appliance holding will be accounted for in the conversion from activities to energy
demand.
table 1: Most frequent household types
Adults
Work Rhythm
Children
Occurrence frequency
Single
Full time
No
617
Single
Inactive
No
163
Single
Elderly
No
496
Single
Full time
Yes
178
Couple
Full time + full time
No
166
Couple
Elderly + elderly
No
200
Couple
Full time + full time
Yes
272
Couple
Full time + part time
Yes
283
Couple
Full time + inactive
Yes
166
In our model, we adopted a three state occupancy model, discriminating between
household members who are absent, present and awake or present and asleep. The
main flow of the model is shown in
The central variables of the model are (1)
the probability to start a certain state as a function of the respondent type, the previous
state and the time and (2) the duration probability as a function of the state, the time and
the respondent type. Both variables are strongly dependent on time – the probability that
individuals go to sleep is clearly higher in the evening than around noon. Furthermore,
when individuals go to sleep in the evening, it is more likely to last several hours, whilst
sleeping around noon typically will last for less than an hour. The start probability and
duration probability matrices were computed for each 30 minute time bin, avoiding the
risk of data scarcity as well as eliminating local effects due to the inaccurate diary
entries. Indeed, it was found that respondents tend to ‘round off’ the start time of their
activities to half an hour instead of the 10 minute time steps, although it is unlikely to be
precise. In comparison to the MCMC technique this approach enables us to obtain more
realistic individual occupancy chains with less computational power. In
an
output example is presented for a household with two adults working full time and one
child. For every discrete time step the occupancy state of each household member is
shown for a weekday.


