I n d i v i d u a l H o u s e h o l d B e h a v i o u r M o d e l l i n g
531
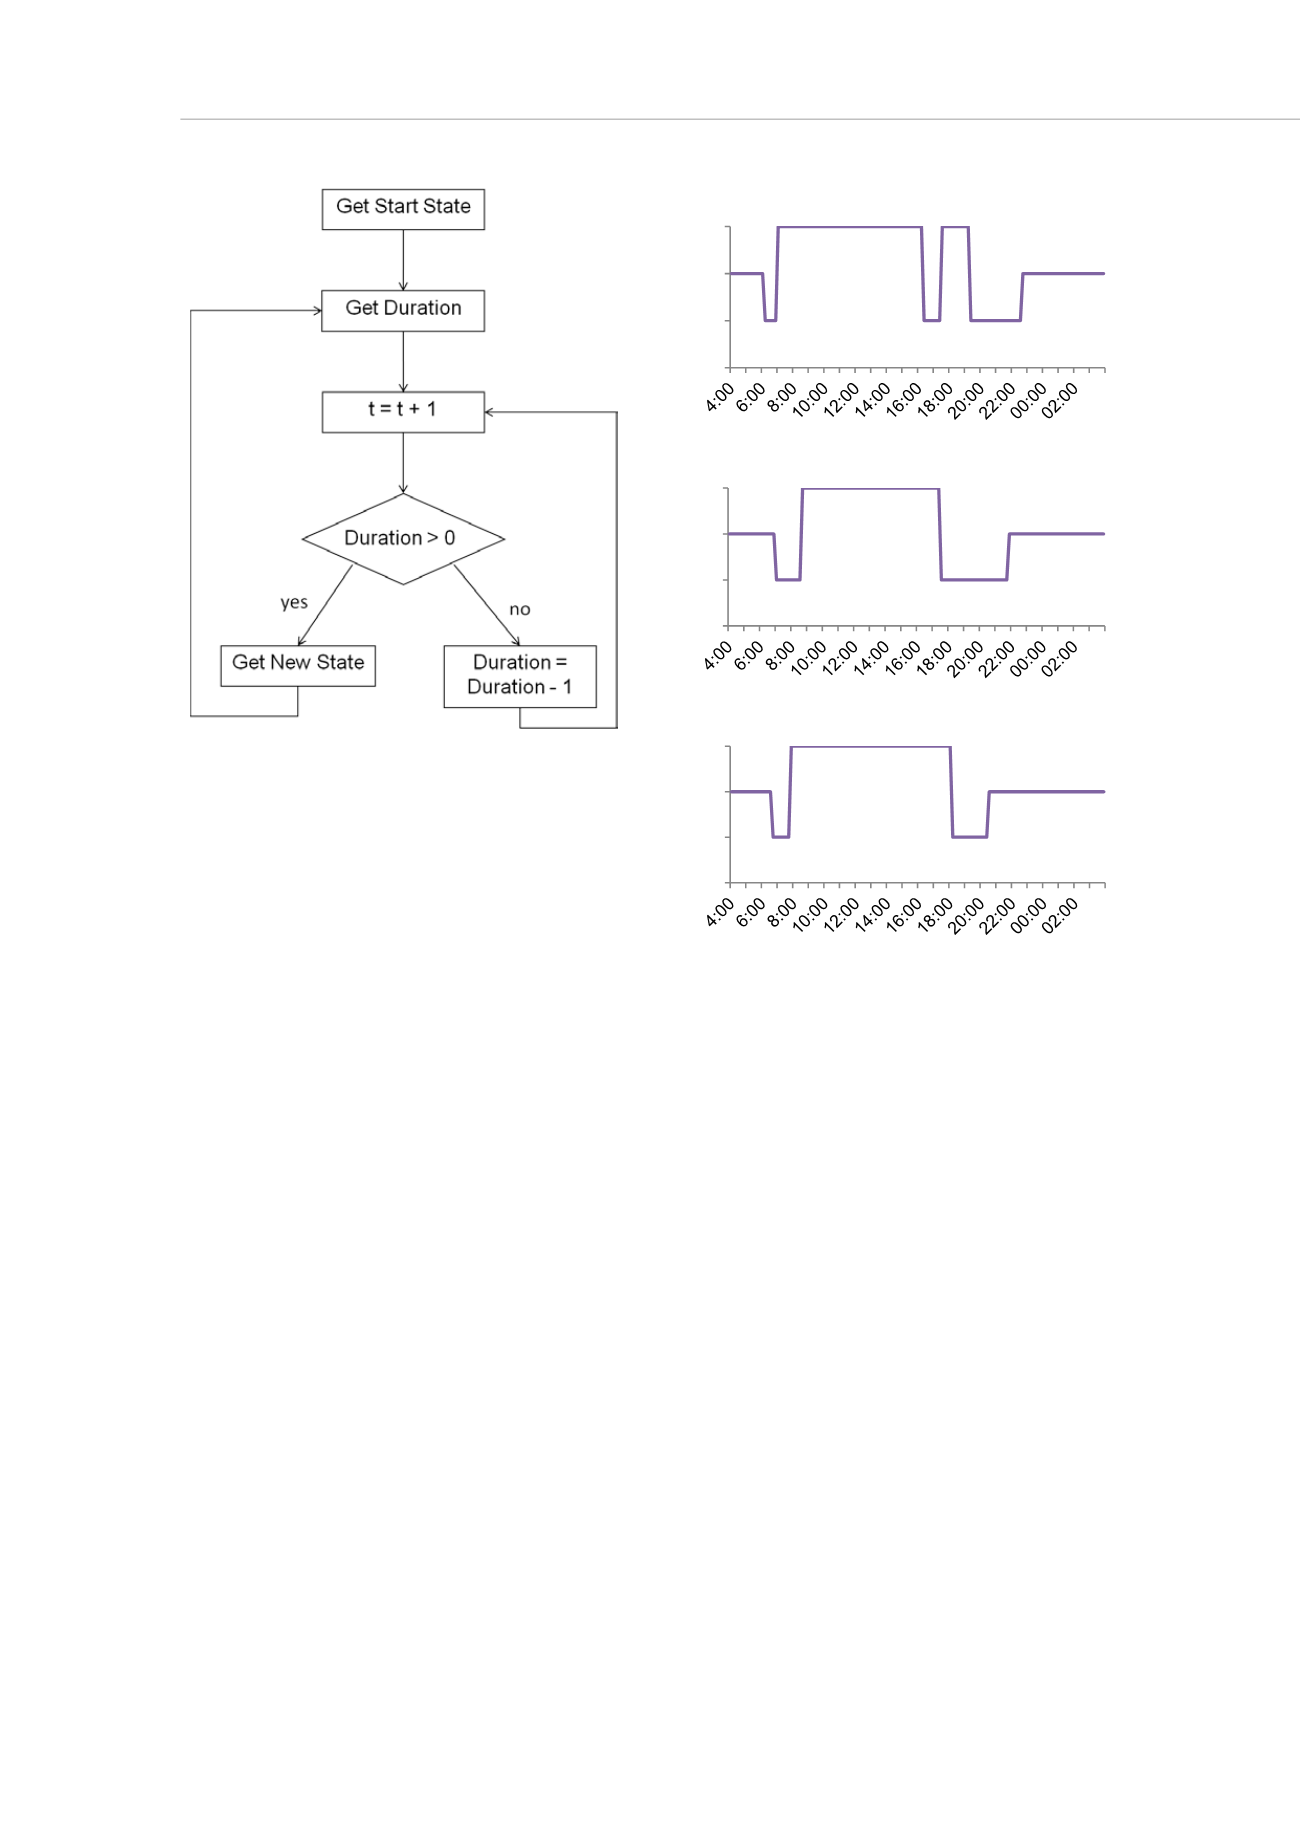
figure 1: Flowchart
occupancy model
figure 2: Example output (2 x full time + children)
with occupancy states (1) present and awake, (2)
present and sleeping or (3) absent
A separate model is built to construct household activity patterns; the main flow of the
model is shown in
From the 272 activities included in the TUS database, all
activities that may lead to energy consumption are selected and merged into 9
categories (see
. All activities involving the use of a computer, such as sending
emails, working or playing games, are merged into one activity. Furthermore, the
activities ‘washing clothes’ and ‘drying clothes’ are joined in one activity. Although
washing and drying clothes are coded as two different activities, hardly any drying
occurrences were found in the database. Since respondents were asked to describe
their activities in their own words, the accuracy of the coded activities fully depends on
the accuracy of their own descriptions. We assume that in this particular case, the
activity was often described as ‘doing laundry’ without further details.
Typically, activity chains are modelled on respondent level and aggregated to household
level, in analogy with occupancy chains. In order to adequately aggregate individual
chains to household level, ‘shared’ activities should be taken into account. However,
since our interest lies in the use of appliances – and not the individual’s time budget –
the model can be simplified by modelling directly on household level and thus avoiding
unnecessary connections between individual’s activities.
0
1
2
3
Occupancy state
Adult 1
0
1
2
3
Occupancy state
Adult 2
0
1
2
3
Occupancy state
Child 1


