Z E M C H 2 0 1 2 I n t e r n a t i o n a l C o n f e r e n c e
724
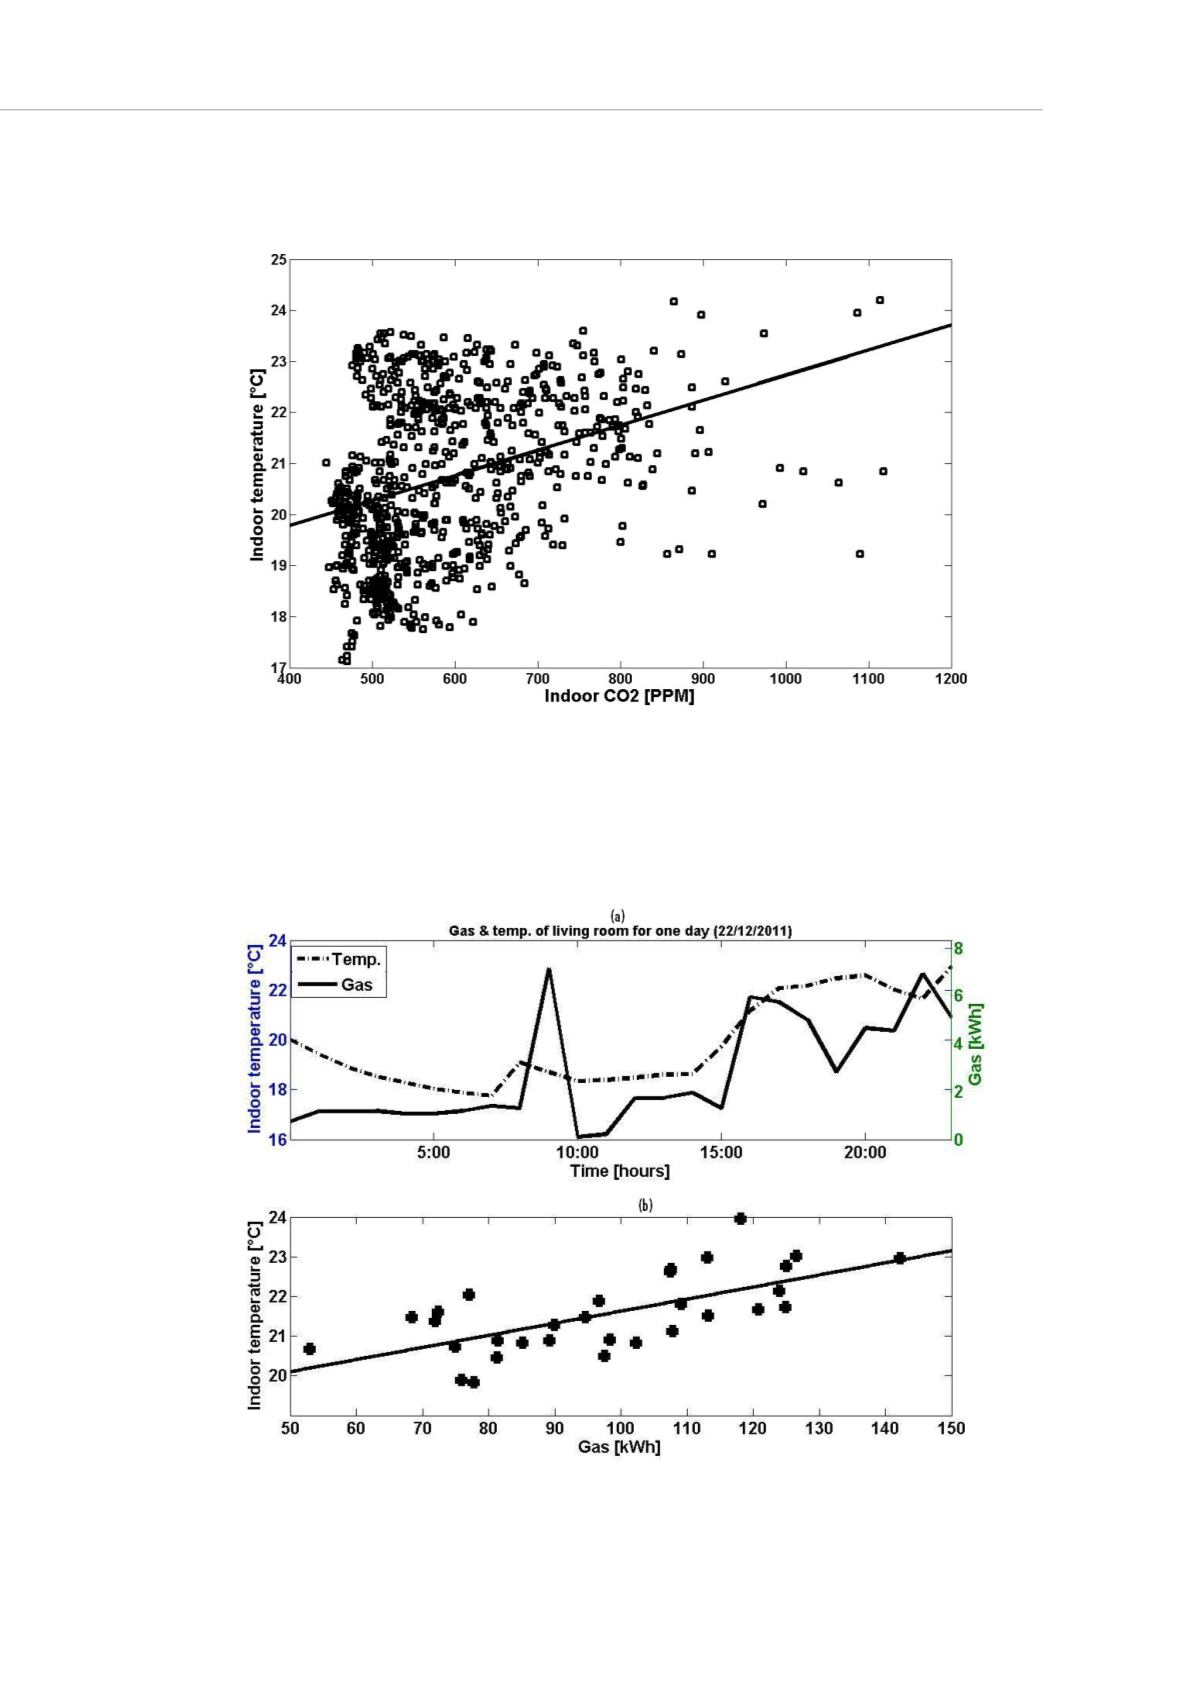
the CO
2
levels are higher, and it also reflects the dilemma of achieving proper ventilation
and indoor thermal comfort.
Figure 6: Correlation of daily carbon dioxide and daily temperature
Day (22/12/2011) was chosen to plot indoor temperature against gas energy
consumption for that day. Figure 7a shows the indoor temperature of the living room is
not affected by the change of gas level consumption (Fig. 7a). Monthly indoor air
temperature and monthly gas consumption were correlated with statistically significant
results (r =0.66, P =<0.05). Figure 7b shows this direct (positive) relation (Fig. 7b).
Figure 7: (a) Indoor temperature and gas energy use of the living room for one day, (b) Correlation of
gas energy use versus indoor temperature of one month


