M e a s u r e d I n d o o r E n v i r o n m e n t a n d E n e r g y C o n s u m p t i o n
723
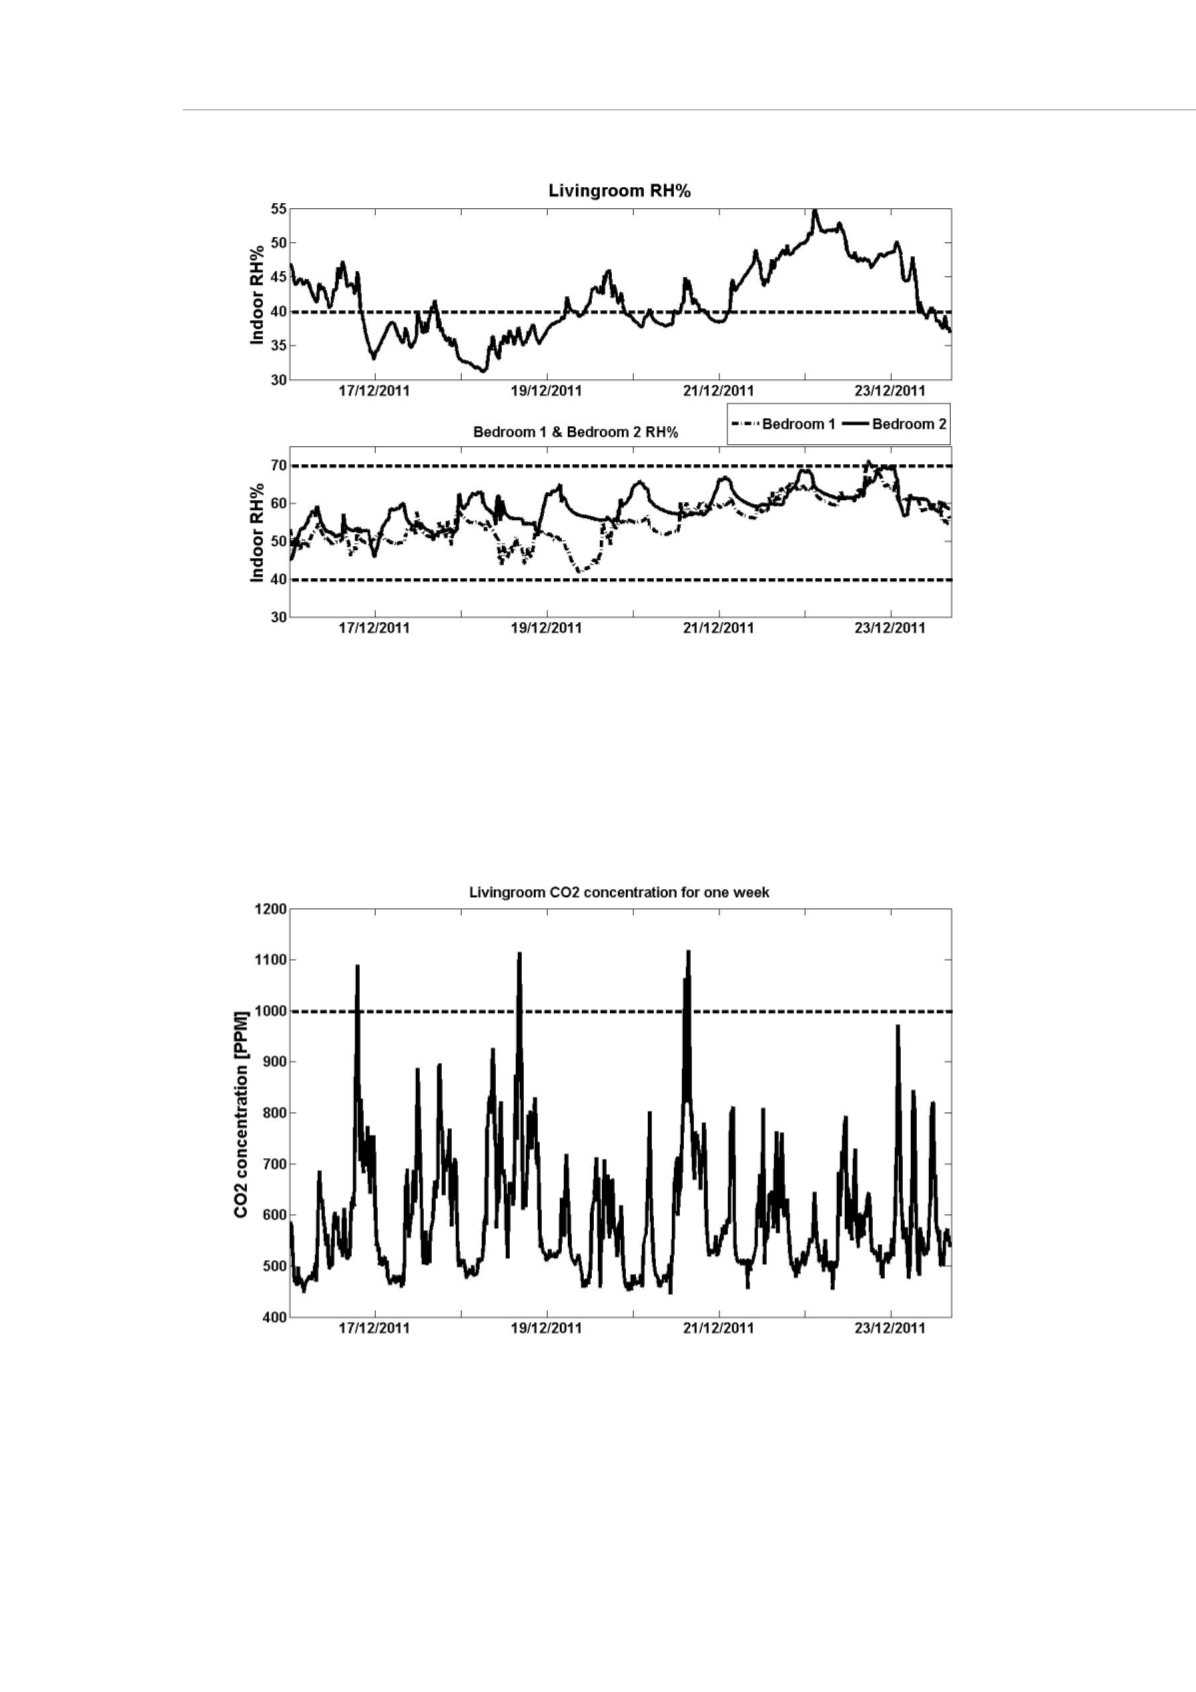
Figure 4: Daily mean indoor relative humidity for the living room and the two bedrooms
Figure 5 shows the indoor CO
2
levels of the living room for one week. It can be seen that
the level is fluctuating under the recommended value for indoor space (ASHRAE 2012),
which indicates the availability of fresh air indoors at all the time in the living room (Fig.
5). The three peaks indicate that there is lack of ventilation during night time due to
closing windows at that time.
Figure 5: Level of CO
2
in the living room for one week
Daily indoor air temperature and daily CO
2
were correlated with statistically significant
results (r =0.35, P =<0.05). Figure 6 shows this direct (positive) relation (Fig. 6). These
results may indicate that the warmer space has lack of air ventilation rates and therefore


