P h o t o v o l t a i c s a n d ( N e a r l y ) N e t Z e r o E n e r g y B u i l d i n g s
311
Figure 7: A world map shows an output of the internal IEA projects database system and localizes
more than 300 known Net Zero Energy Buildings (each typology with an own color). The map with
additional buildings information is available under [IEA 2008].
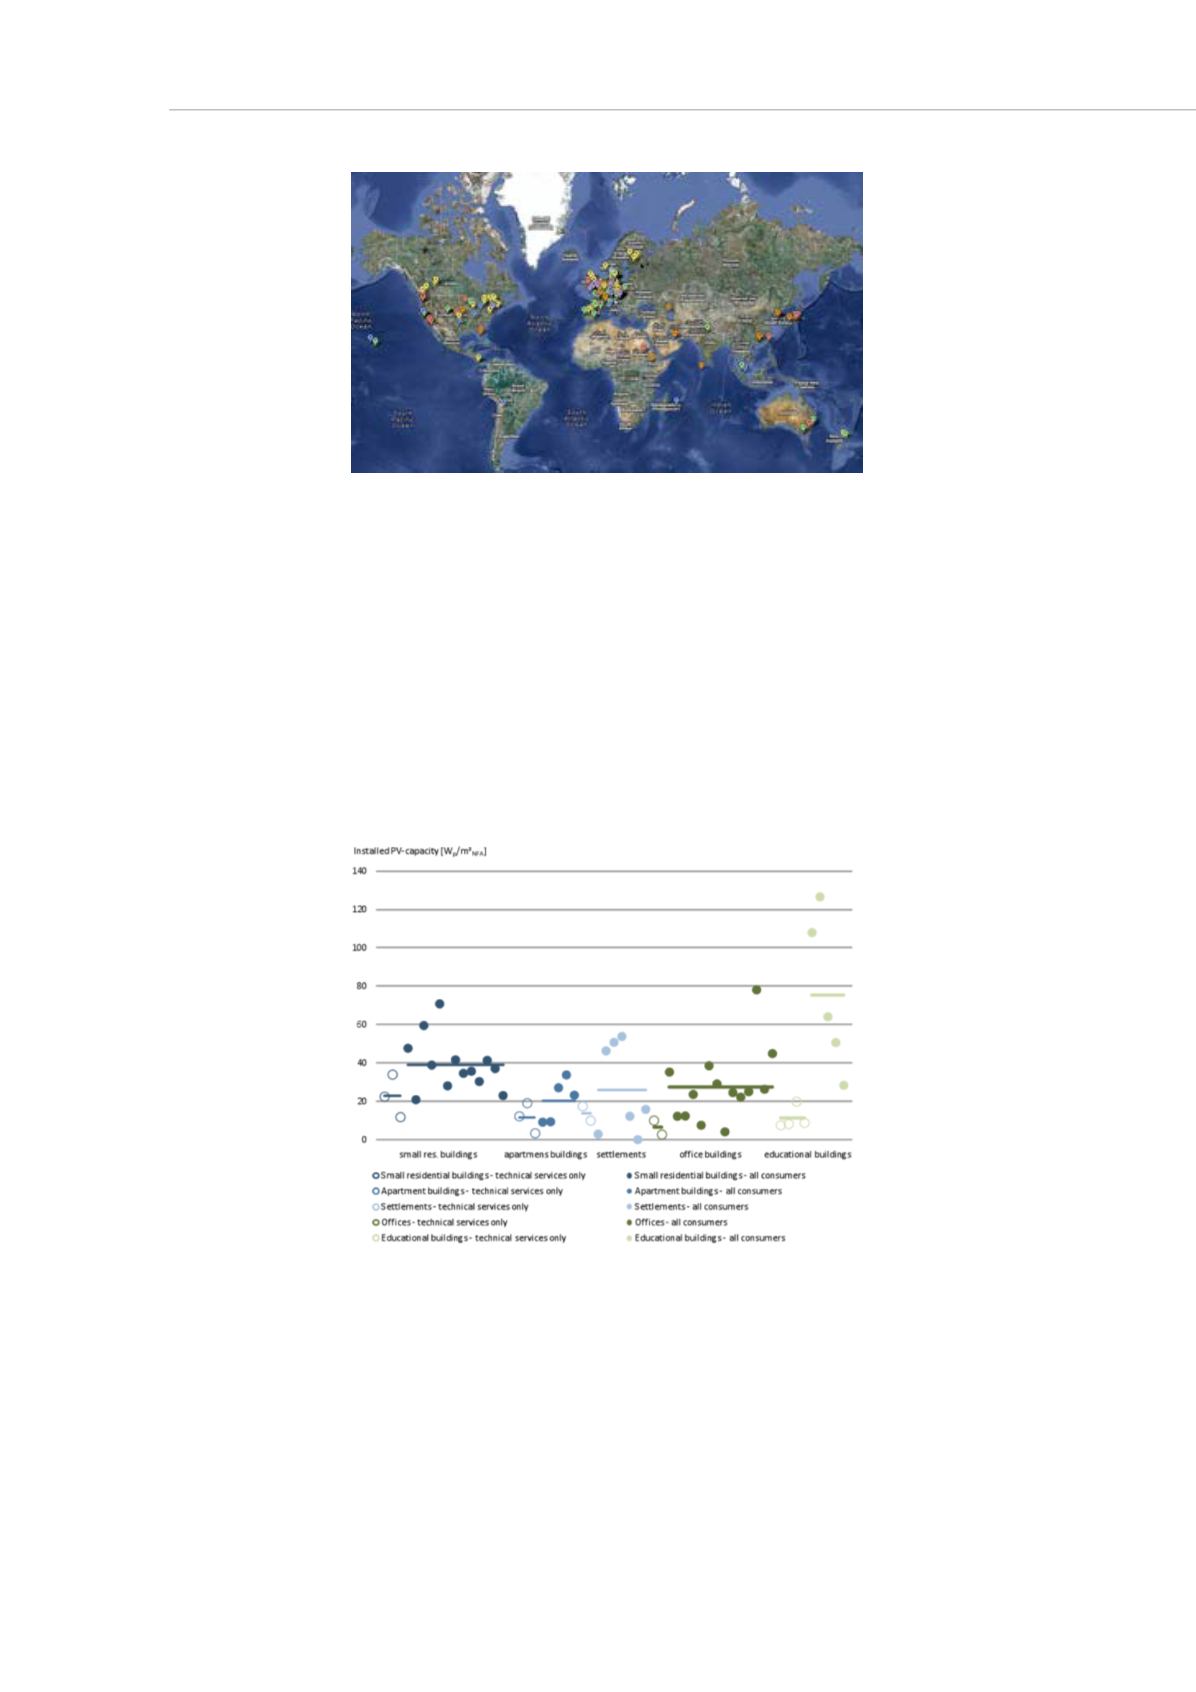
Office buildings require a PV capacity of around 7 W
p
/m²
NFA
(0,05 m
2
/m
2
NFA
at a PV
power density of 120 W/m
2
) to equalize their primary energy balance if only the EPBD
related energy demands are included. If the demand is expanded by “user specific”
consumptions this value growths to 27 W
p
/m²
NFA
(0,22 m
2
/m
2
NFA
at a PV power density of
120 W/m
2
. While factories have a similar value (21 W
p
/m²
NFA
or 0,17 m
2
/m
2
NFA
at a PV
power density of 120 W/m
2
) this varies greatly in educational buildings depending on the
type of use (school, academy, or nursery) as shown in figure 7. Generally in
refurbishment projects larger PV plants are used. CHP, wind power or buying “green”
electricity is usual and mostly necessary in large, non-residential buildings [Voss Musall
2011].
Figure 8: IEA Task 40-Annex 52 case studies analysis. Installed capacity of PV systems per m²
NFA
(Subdivisions in buildings which balance includes the technical building services only or all energy
consumers). Source: University of Wuppertal [Voss Musall 2011]
4.2 Challenges for the use of PV for Net ZEBs
From the technical point of view, the main obstacles to face are intrinsic in the Net ZEB


