Z E M C H 2 0 1 2 I n t e r n a t i o n a l C o n f e r e n c e
390
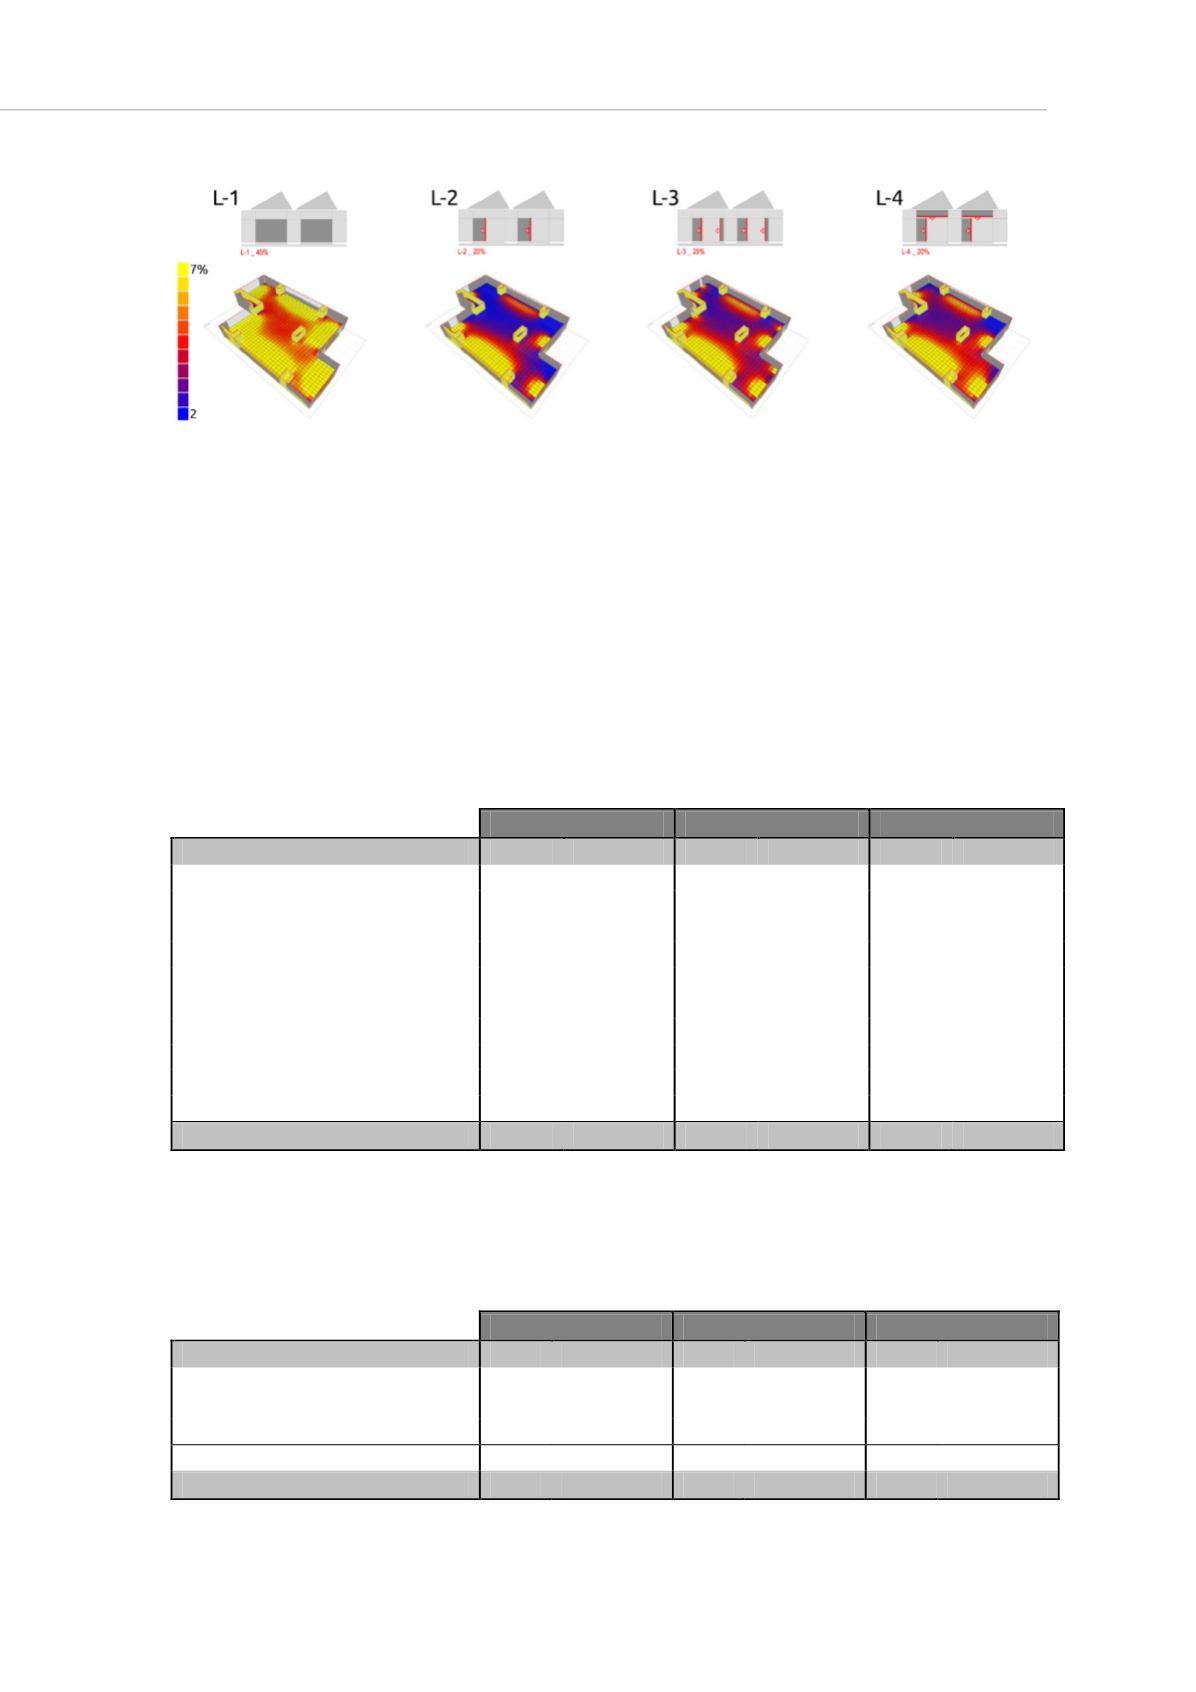
Figure 5. Daylight factor analyses for different windows configurations.
The model L-3 resulted to be the most effective for its homogeneous distribution of
daylight inside the house. Thus the M-3 model for measuring thermal performance in
SIMIEN has been adjusted consequently.
Results - collected in table 3 – show that the Passive house criteria could not be fulfilled
even when using extremely insulating and air-tight envelope like in the third set of
parameters M-3. In this case Norwegian Low-Energy targets only could be fulfilled with a
annual heating demand of 30 KWh/m
2
. It seemed also that the model could not easily be
further optimized and that Passive house standards were somehow a very difficult target
to reach.
Table 3: Simulation model Energy demand (SIMIEN)
ED_Energy Demand
M-1
M-2
M-3
KWh KWh/m
2
KWh KWh/m
2
KWh KWh/m
2
Heating
4537
42,65 3621
34,04 2970
27,92
Ventilation heating
0
0,00 0
0,00 0
0,00
Hot water
3170
29,80 3170
29,80 3170
29,80
Fans
207
1,95 207
1,95 207
1,95
Pumps
68
0,64 60
0,56 68
0,64
Lighting
932
8,76 932
8,76 932
8,76
Technical system
1243
11,68 1243
11,68 1243
11,68
Cooling
0
0,00 0
0,00 0
0,00
Ventilation cooling
0
0,00 0
0,00 0
0,00
Total
10157
95,48
9233
86,79
8590
80,75
In order to calculate the operational emissions and proceed with the ZEB verification of
the project, the delivered energy was calculated for the three sets of parameters with the
following results:
Table 4: Simulation model delivered energy (SIMIEN)
DE_Delivered Energy
M-1
M-2
M-3
KWh
KWh/m
2
KWh
KWh/m
2
KWh
KWh/m
2
Direct electricity
2450
23,03 2441
22,95 2450
23,03
Electricity (heat pump)
1968
18,50 1674
15,74 1464
13,76
Electricity (solar system)
110
1,03 105
0,99 102
0,96
Total
4528
42,56
4220
39,67
4016
37,75


