Z E M C H 2 0 1 2 I n t e r n a t i o n a l C o n f e r e n c e
392
PV production.
Different possible configurations of PV integration have been considered in order to
reach the target of 8109,4 KWh/y production. Alternatives have been grouped in two
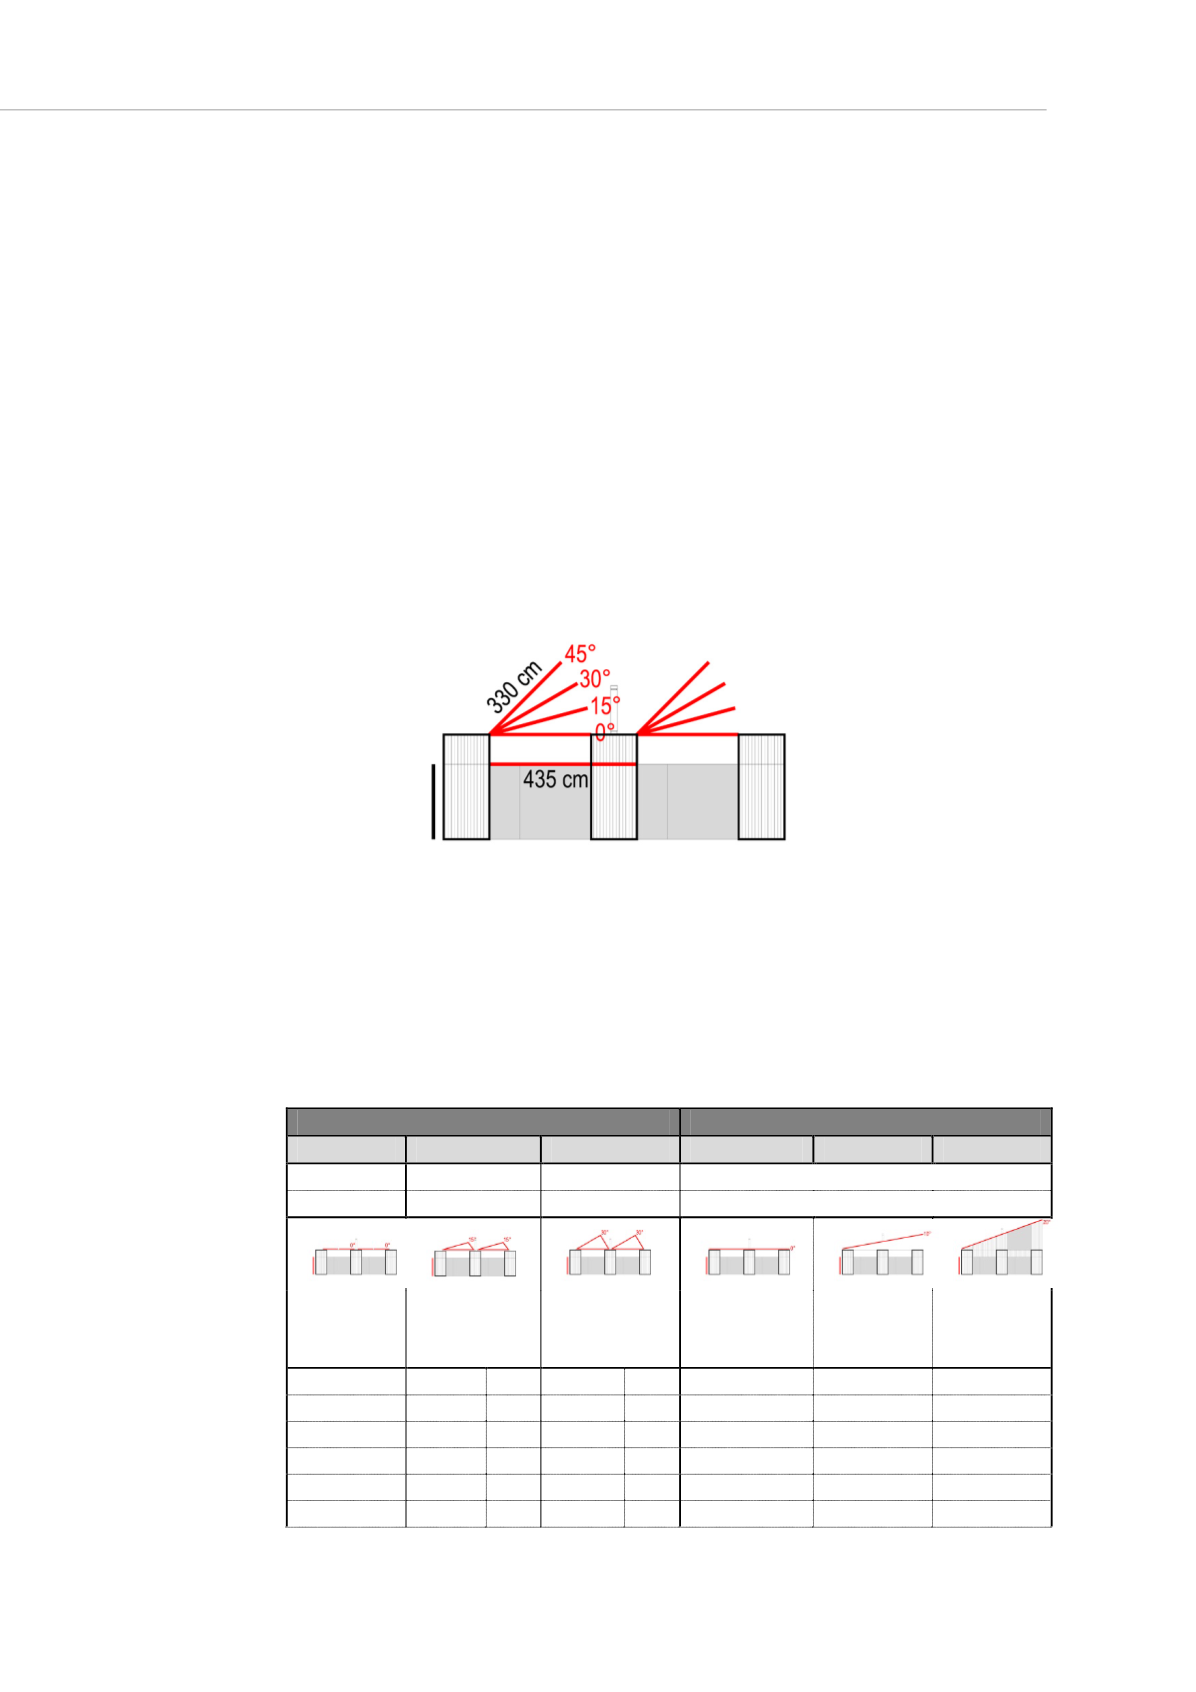
main categories (table 5). The first group of alternatives, more coherent with the building
concept and construction, is characterized by two slabs that can be tilted with different
angles. The width of each slab is of 330 cm (twice the length of a standard PV panel).
This dimension fit also the maximum height for transporting the component inside a
trailer (340 cm max). This system has clear advantages in the possibility of integrating
the PV system inside the roof component even before transporting it. The biggest
disadvantage is related to the partial shading of the system and consequent losses
(calculated in table 5).
The second group of alternatives is on the other hand characterized by one singular slab
that can be also in this case tilted with different angles. The clear advantage of this
system is its simplicity of construction. Its larger surface of PV integrated (with no
shading) ensures maximum energy production. The disadvantages are the difficulties in
integrating the construction of the system in the building components and the
consequent impact on the aesthetic of the building.
Fig.5 PVSYST SIM model: constants and variables.
Calculations have been performed in PVSyst considering the efficiency of commercially
available panels used in the project (230 W/module of standard dimension 165x99 cm,
equivalent to 140Wp/m
2
). Results, collected in table 5, shows that is possible in both the
cases to reach the target of 8109,4 KWh per year. This means that even the array of 48
PV panels will make the +hytte an energy positive producer over the course of the year.
Table 5: Simulation models produced energy (PVSyst)
TWO SLABS
ONE SLAB
0º
15 º
30 º
0 º
10 º
20 º
KWp
11.04
11.04
11.04
16.01
16.01
16.01
Panels
48
48
48
70
70
70
4,8 %
Shading
losses
10,2 %
Shading
losses
*
*
JAN
97
125
5
140
9
143
201
255
FEB
248
299 11
319
23
363
460
547
MAR
585
670 25
686
50
856
994
1110
APR
939
1022 38 1008 75
1374
1489
1571
MAY
1524
1597
60
1567
11
2230
2338
2401


